Pricing Actions and Analytics: Profit Analytics
Eva provides detailed profit analytics for each SKU based on sales made in the last 7-14-30-60 days. In order to check, you can follow these steps;
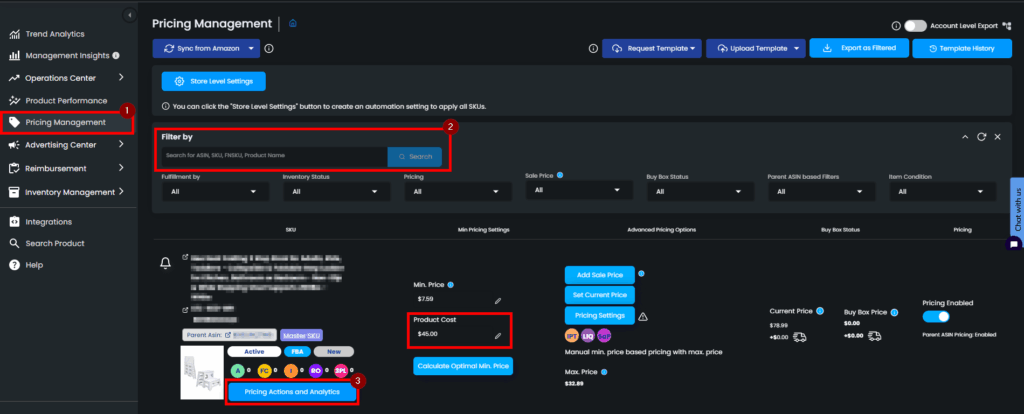
- Go to the “Pricing Management” page.
- Find the relevant SKU or search it on “Filter By”.
- Click on the “Pricing Actions and Analytics” button.
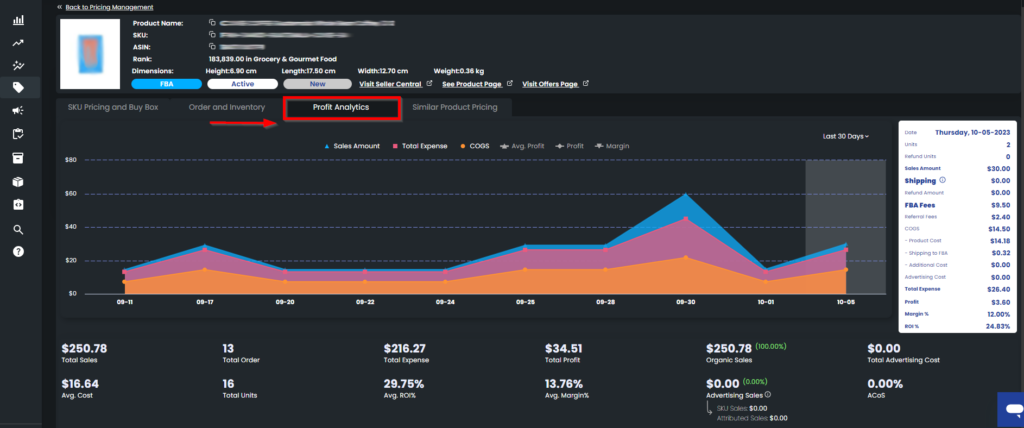
- Click on the “Profit Analytics” tab to see the related chart for the relevant SKU.
Note: Profit Analytics is only available if the product has a Product Cost.
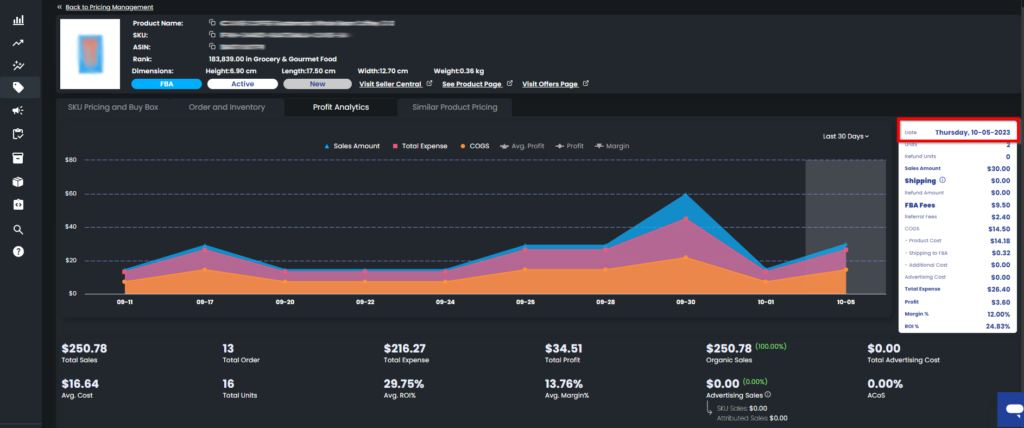
Understanding the Profit Analytics Chart
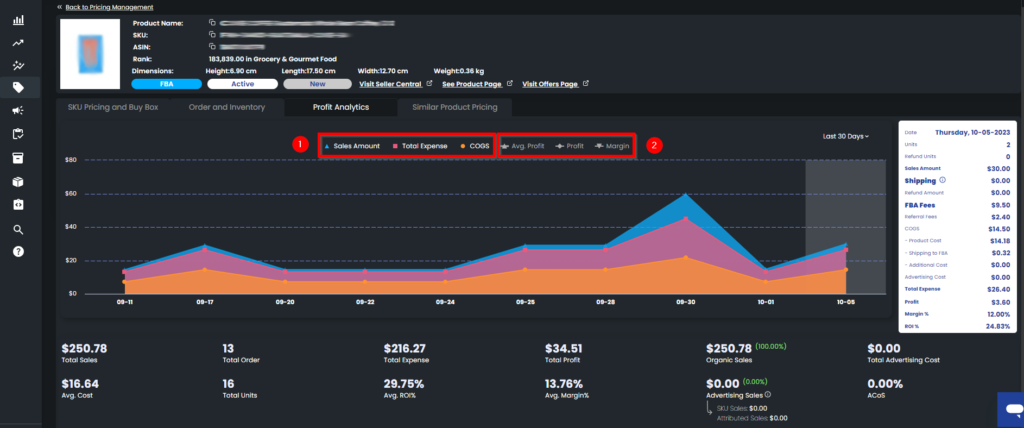
On the Profit Analytics chart:
- The following data as default is: “Sales Amount“, “Total Expense“, and “COGS”
- It is also possible to include “Average Profit“, “Profit“, and “Margin” by clicking on the name of the data you want to include.
Each data is represented with a color, which is shown with a colored ball next to them.
Note: The cost data is calculated based on historical costs.
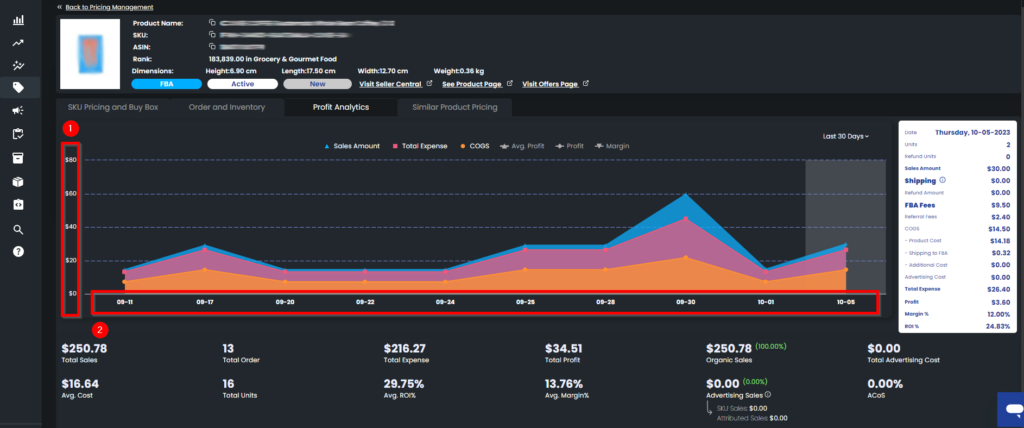
This is a two-axes chart. The first axis represents the monetary amount and the second axis represents the date.
It is an interactive chart, which means that you can include or exclude each data from the chart with a simple click. To do so, you can go and click on the related data. The data that you have excluded will fade.
On the right side of the chart, there is a detailed list of each date when there was a sale for the particular SKU.
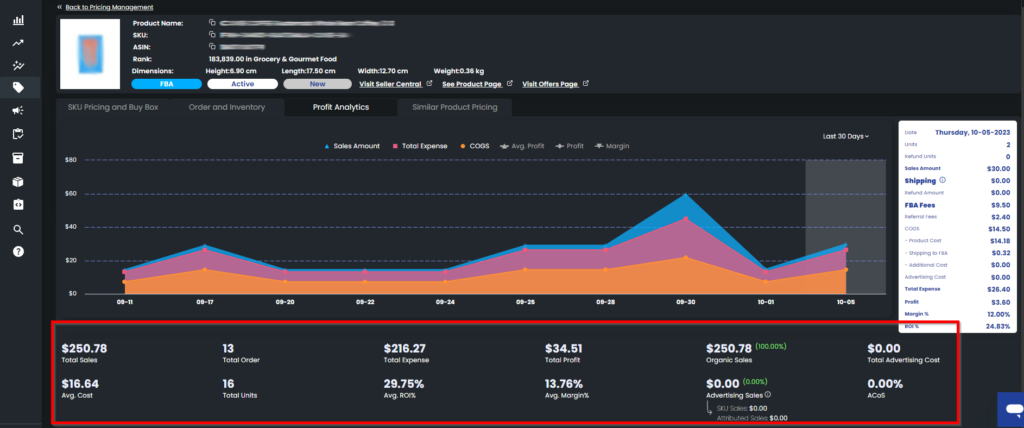
Detailed List
It is possible to check the detailed list for each date. To do so, you can go and click on a particular date on the chart, and on the right side, you can see the related list.
If you have not added your Amazon Advertising Account to Eva yet, you will see a “Connect Advertising” button next to “Advertising Cost” in the list. You can simply click on it to add your Amazon advertising account to Eva.
At the bottom of the chart, the sum of the following data for the last 30-days is displayed;
- “Total Sales“, “Total Expense“, “Total Profit“, “Organic Sales“, Total Advertising Cost“, “Advertising Sales“, and “ACoS“
In addition, the average of the following data for the last 30-days is displayed;
- “Avg. Cost “, “Avg. ROI%, and “Avg. Margin%
To change the time slot, you can go and click on the dropdown menu on the upper right side.
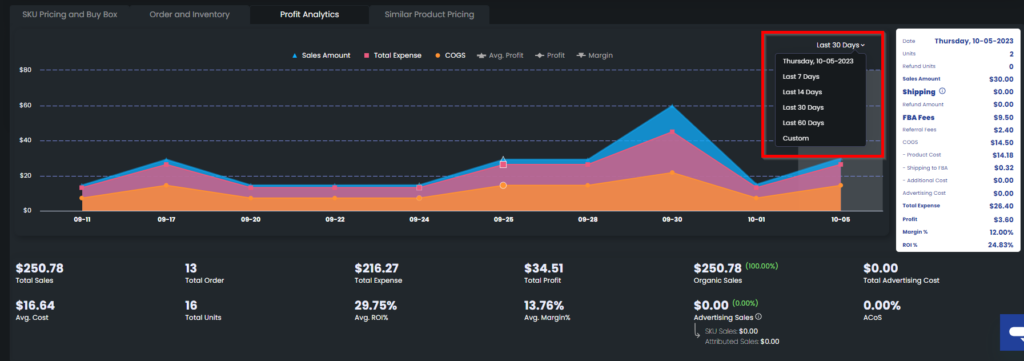
Note: On the chart, there might be a 1-2 day delay in fetching the present day’s data resulting from increased download times.
“Ready to Elevate Your Success? Schedule a call with our experts today – simply click this link and choose a time that works best for you!”