Aggregated Stores View
When you have multiple stores, it might get harder to make an overall analysis and handle your businesses altogether. Aggregated Stores View enables you to monitor all your sales, expenses, COGS (Cost of Goods Sold), and reimbursements over the last twelve months in one place and analyze all the stores holistically.
To view aggregated data from all of your marketplaces, head over to the ‘Aggregated Store View‘ section seen in Figure 1. You will be greeted with the Aggregated Executive Dashboard which includes Sales & Finance Chart and Expenses, Refunds & COGS Chart.
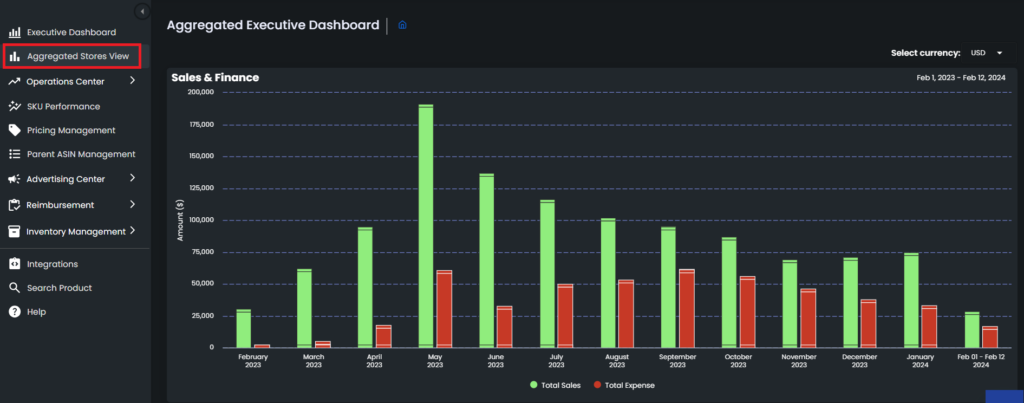
Sales & Finance chart rolls out monthly data. It gives a deeper insight into the aggregated outgoes of a specific month. It is a two-axis chart and each one is explained below.
Axis 1: This axis demonstrates the monetary amount in the currency of the marketplace of the store. You can see which currency is used in the brackets.
Axis 2: This axis demonstrates the historical data. All these data are batched on monthly basis and color coded with Total sales shown in green and Total expenses shown in red.
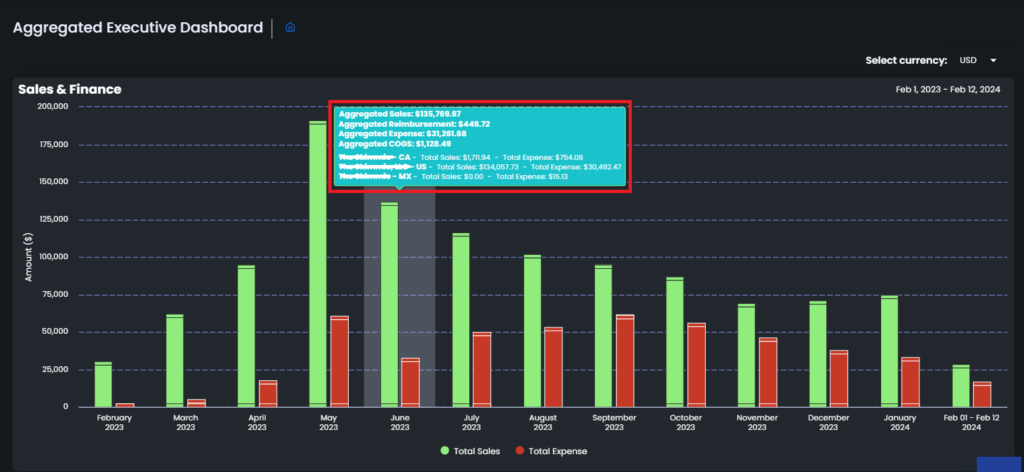
It is possible to monitor detailed information for each month. To do so, go and hover over the bars of the related month. A pop-up list will appear. On this list, you can monitor the detailed data, which are respectively, ‘Aggregated Sales’, ‘Aggregated Reimbursement’, ‘Aggregated Expenses’, ‘Aggregated COGS’ and ‘Total Sales’ for each store. Please see Figure 2 below.
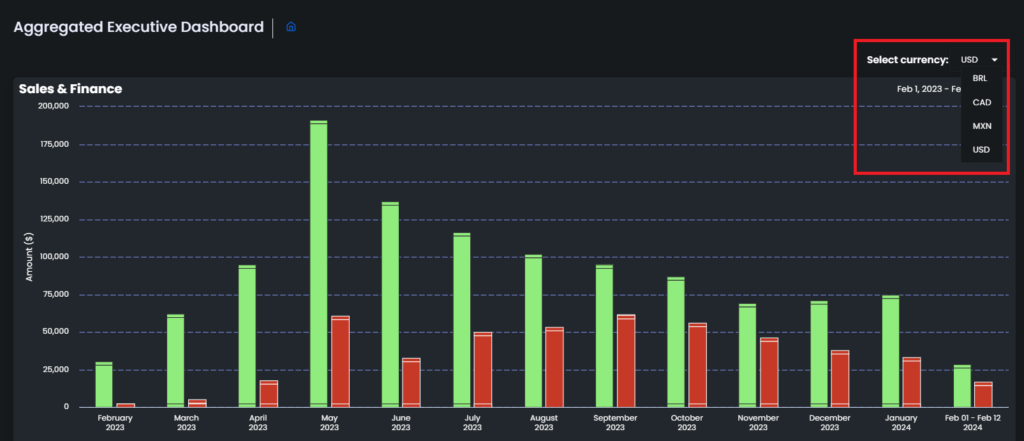
You can also select which currency you want the data to he displayed in using the ‘Select currency‘ dropdown menu on the upper right corner, please see Figure 3.
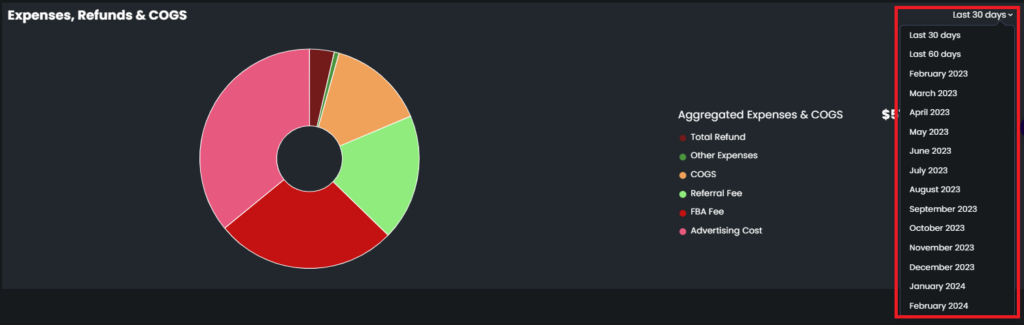
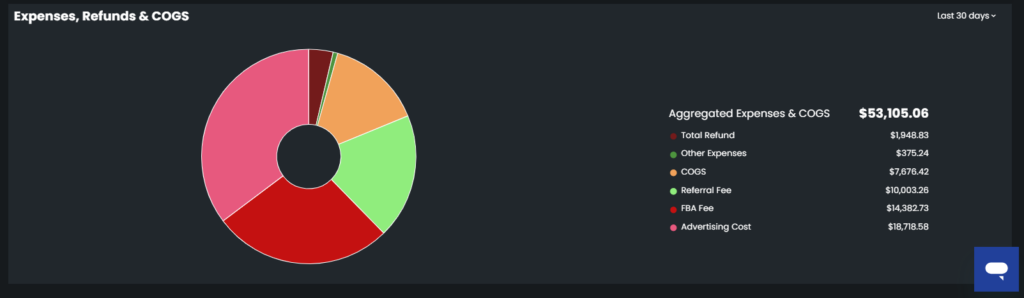
Expenses, Refunds & COGS chart displays the aggregated expense data such as COGS, refunds, FBA fee, referral fee, FBA shipping fee, FBA storage fee, advertising cost, and other expenses and so on. These outgoes are plotted on a pie chart for and their monetary amount is listed on the right side, please see Figure 4.
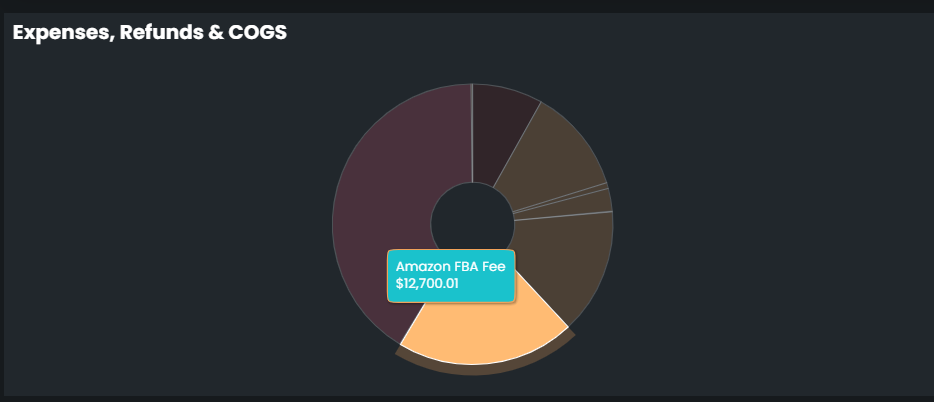
On the pie chart, you can go and hover over a specific color and a pop-up text will appear. The pop-up text shows what this part of the chart stands for, and also the amount of the represented outgo. The rest of the outgoes will be thrown out of focus. Please see Figure 5.
It is also possible to change the time range from the drop-down menu on the upper right side. To do so, go and hover on the time range or on the marker; a dropdown menu will appear, from which you can choose the time range.