Operations Center: Daily Sales
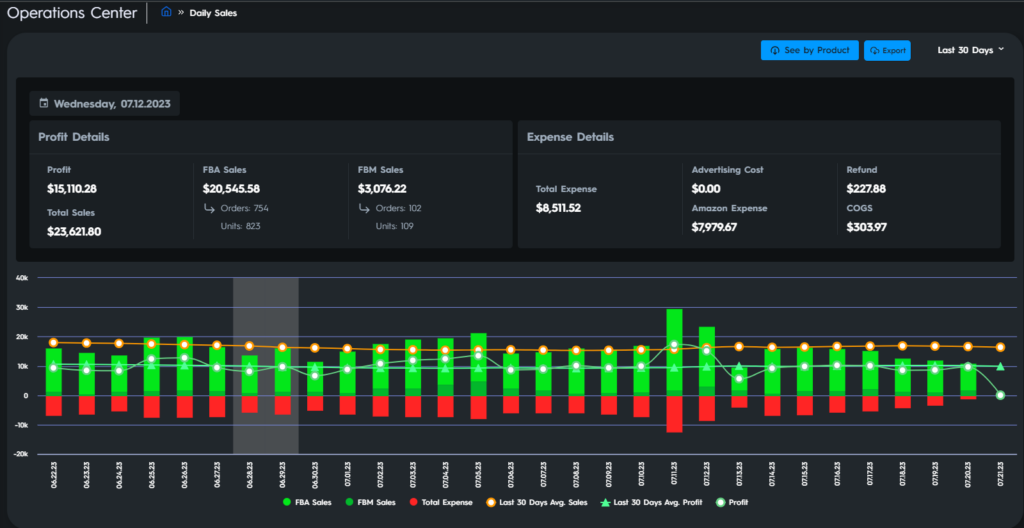
The Daily Sales graph provides a detailed look into your daily sales, profits and expense data on SKU level. To view this graph, you need to hover to the “Operations Center” and then click on the “Daily Sales” button. The graph displays the data of sales and profit on a daily basis along with their average in the last 30 days.
Note: In the daily sales chart advertising cost is deducted from profit data.
The chart rolls out both categorical and numeric data for sales and profit.
It is a two-axis chart and you can find explanations below.
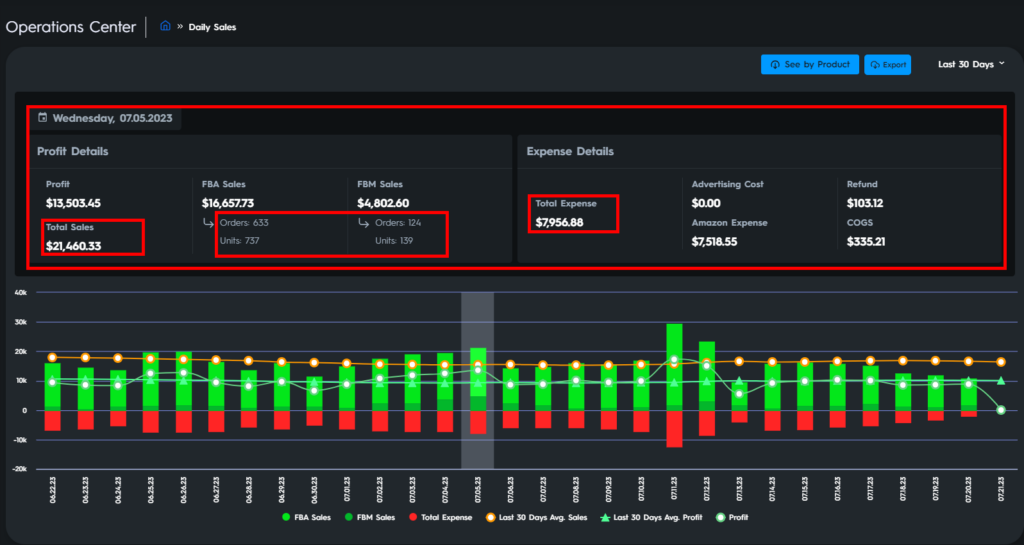
Axis 1: This axis demonstrates the monetary amount in the currency of the marketplace your store operates in. You can see which currency is used in the brackets. Please see Figure 1 below.
Axis 2: This axis demonstrates the historical data. The data is batched on a daily basis. Please see Figure 1 below.
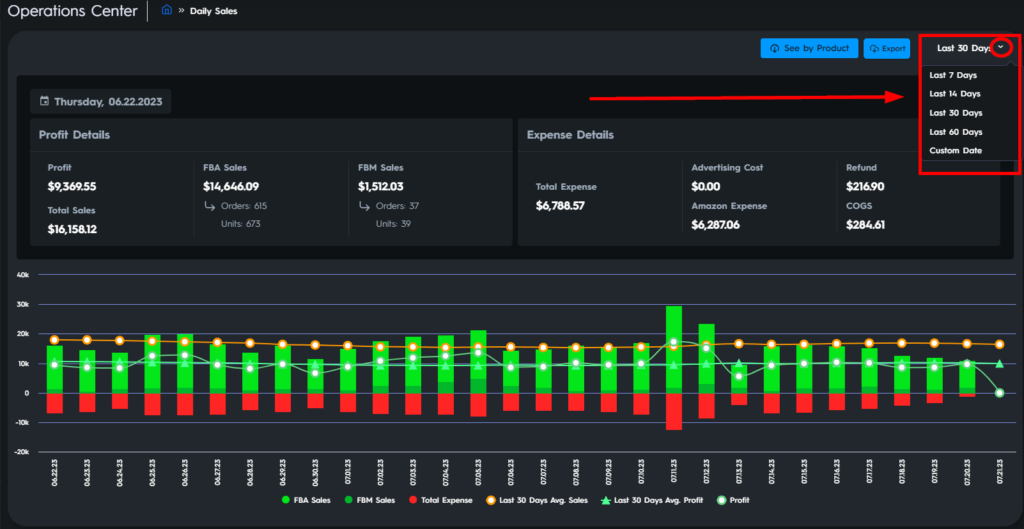
It is possible to check the relevant data over the last 60, 30, 14, and 7 days or you can use the Custom date in the last 60 days. You can change the time slot by using the dropdown menu on the upper right side. Please see Figure 2 below.
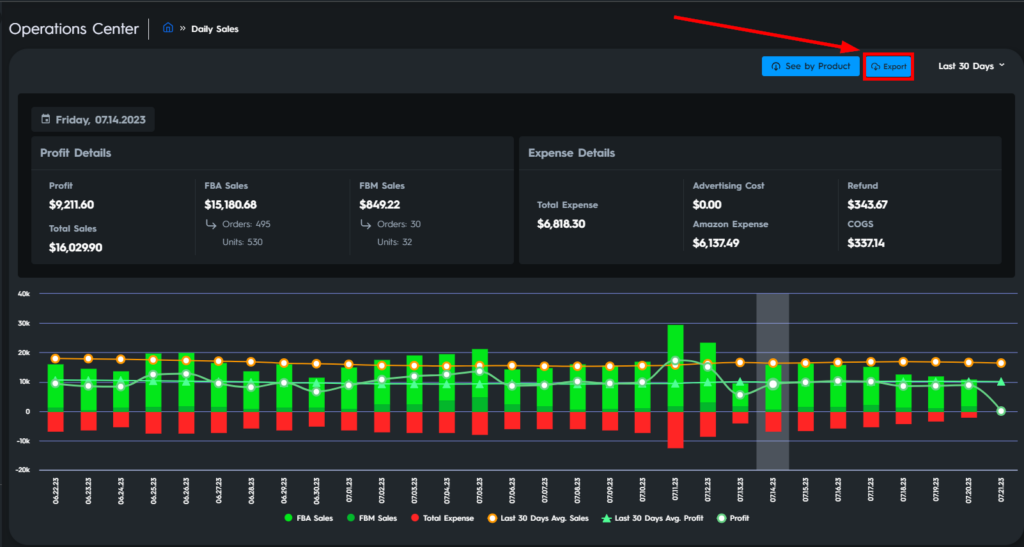
You can also download an Excel file where you can find detailed information for the sales in the respective selected period. Choose the time slot of which data you want to see and then go and click on the ‘Export’ button to download the file. Please see Figure 3 below.
Each color represents a specific group on the chart, which is indicated by the color balls and figures next to the related group.
The sales amount for each day is on the card above. When you want to see detailed data about a day, go and hover over the bar of the related day, and the above card will display the related day. You’ll be able to display sales, profit, number of orders, and the number of units. Please note that units represent the total number of items in all the orders on that day. Please see Figure 4 below.
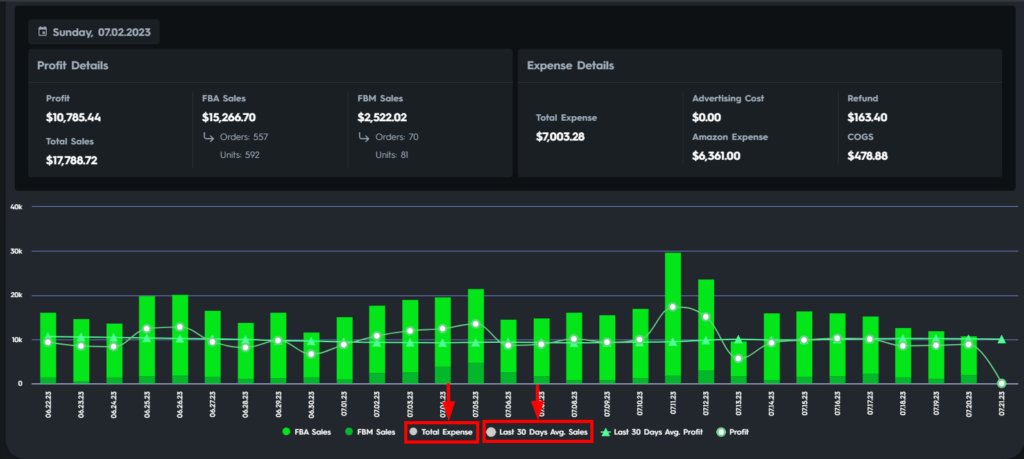
If you want to exclude one or more than one of these groups, go to the related group and click on the group name. The data of the related groups will be excluded from the chart. When you want to include them back into the chart, simply go and click on the group again. Please see Figure 5 below.
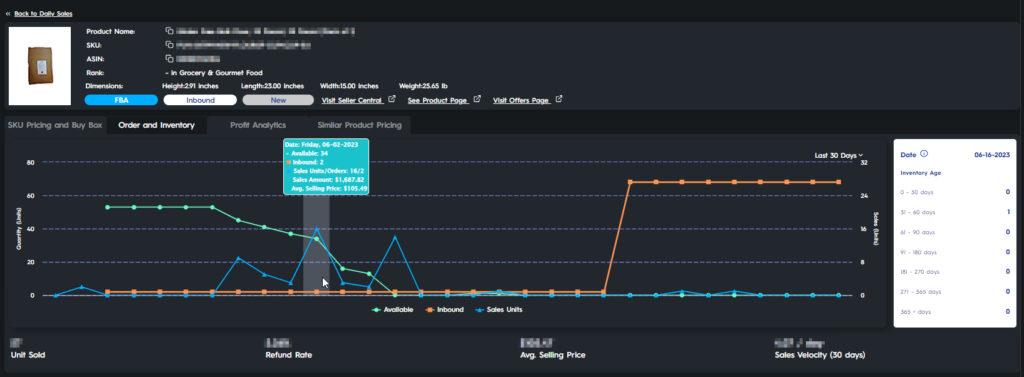
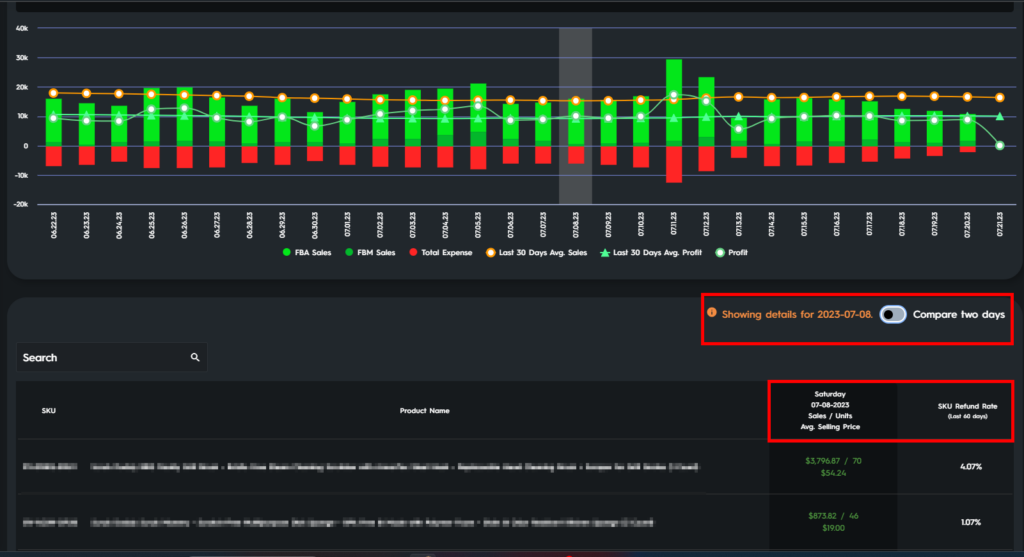
It is also possible to check the detailed information on the SKU level for each day. To do so, go and click on the bar of the related day, you will see every SKU sold on that day with the information of ‘Sales Amount’, ‘Number of Units Sold’, ‘Average Selling Price’, and ‘SKU Refund Rate’ down below. Besides you can filter a specific SKU by using the search bar. Please see Figure 6 below.
Comparing Sales
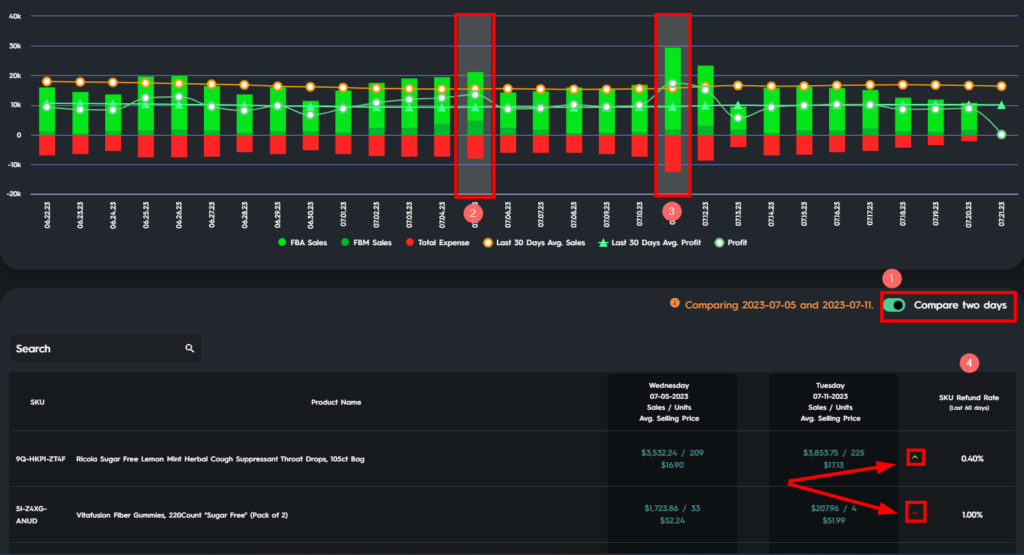
You can compare the sales on two different days. To do so, click the toggle for ‘Compare two days’. Select the desired dates and a detailed breakdown will be shown. Please see Figure 7 below. Box 1 is where you can turn on the feature. Box 2 represents the data for the first day chosen, Box 3 represents the data for the second day chosen. The red cursor facing down represents a decrease while the green cursor facing up represents an increase. Box 4 represents the refund rate of the SKU in the last 60 days.
Note: If you want to turn off the feature just click on the toggle again.
When you click on an SKU – yes, it is interactive – the related related ‘Pricing Actions and Analytics’ card will pop up where you can check all the detailed information. Please see Figure 8 below.