Pricing Actions and Analytics
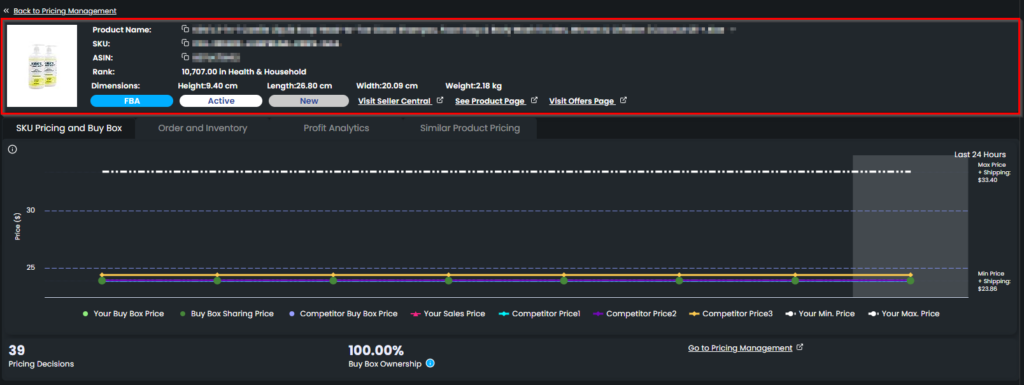
When you click on Pricing Actions and Analytics button on an SKU in the Pricing Management section, Eva leads you to the analytics page. Here you can find product-related information on the upper side. Please see Figure 1 below.
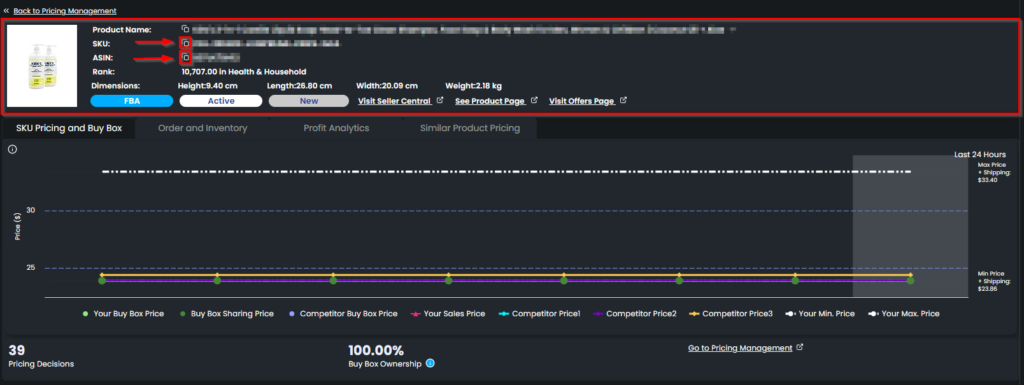
It is possible to see respectively “Product Name“, “SKU“, “ASIN“, “Rank” and “Dimensions“. You can easily copy “Product Name“, “SKU“, and “ASIN” by clicking on the little icon next to related text. When you hover over the icon, an informative text will pop up. Once you click on the icon, the related text will be copied automatically. Please see Figure 2 below.
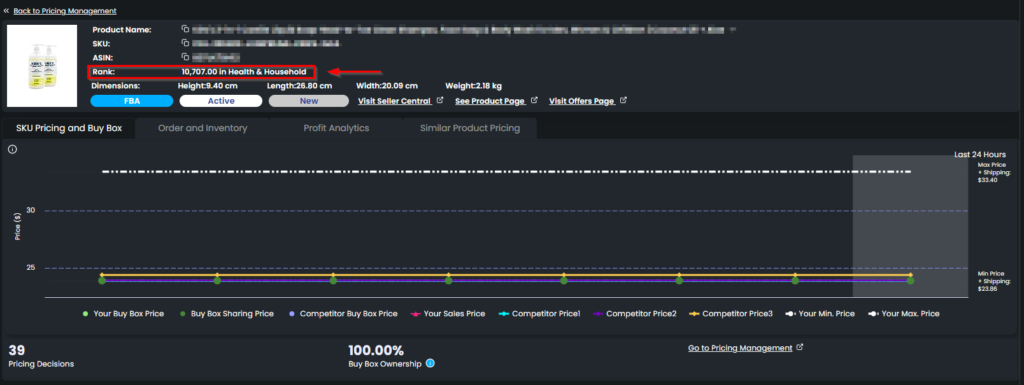
“Rank” illustrates the rank of the product in the category of the product sold. Please see Figure 3 below.
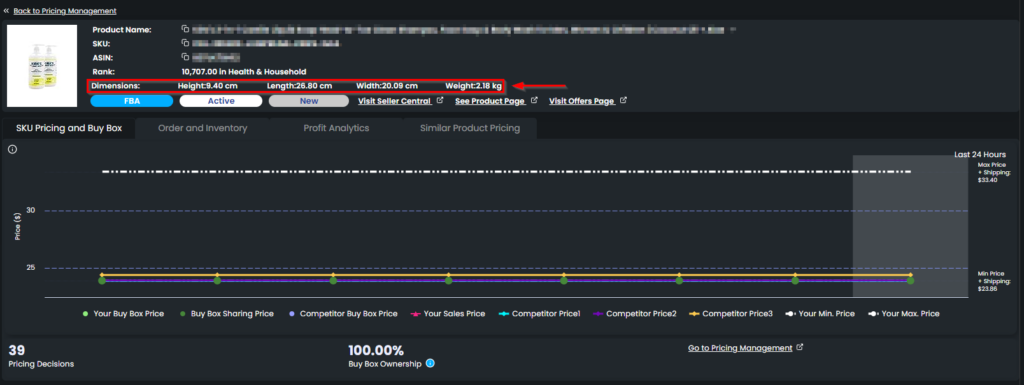
You can also see the dimensions of the product on this page. Please see Figure 4 below.
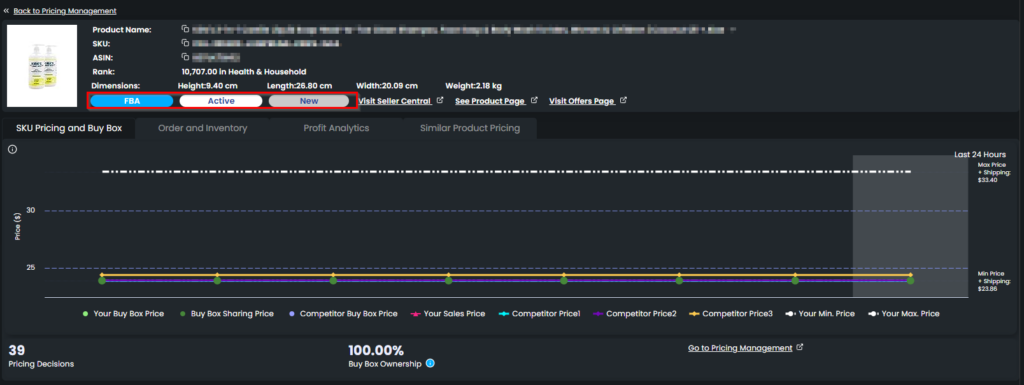
The tags represent the fulfillment type of the products, which can be either “FBA” or “FBM“; SKU status, which can be “Active“, “Out of Stock“, “Closed” or “Blocked“, and SKU condition, which can be “New“, “Like New“, “Very Good” “Good” or “Acceptable“. Please see Figure 5 below.
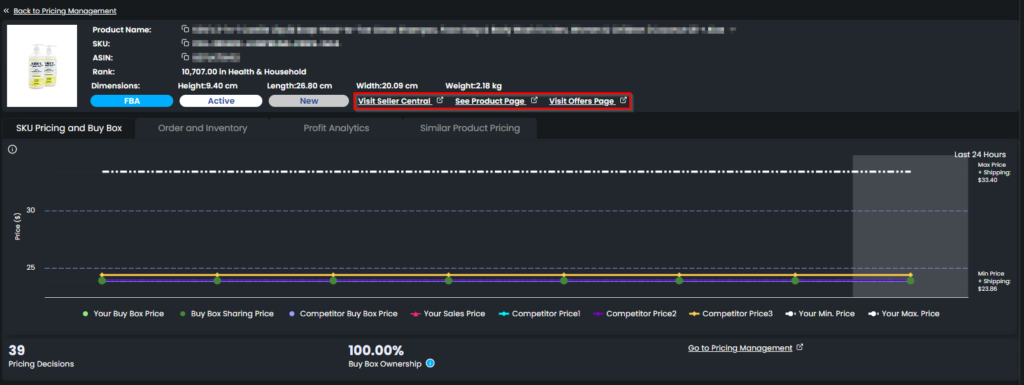
Next to the tags, you can see shortcuts to go to “Seller Central“, “Product Page” and “Offers Page“. You can visit all these pages with one single click. Please see Figure 6 below.
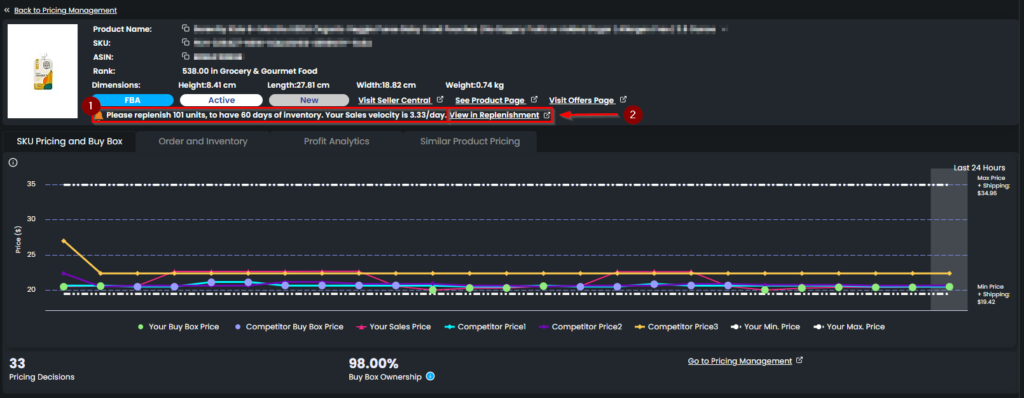
If the SKU you check is in the “Replenishment Alert Interval” or “Stock Out Alert Interval”, there is a notification indicating replenishment-related information. Please see arrow 1 in Figure 7 below. In addition, there is a link that you can use to see the SKU on the Replenishment page. Please see arrow 2 in Figure 7 below.
Please note that the red bell stands for “Stock Out Alert Interval” and the yellow bell stands for “Replenishment Alert Interval“.
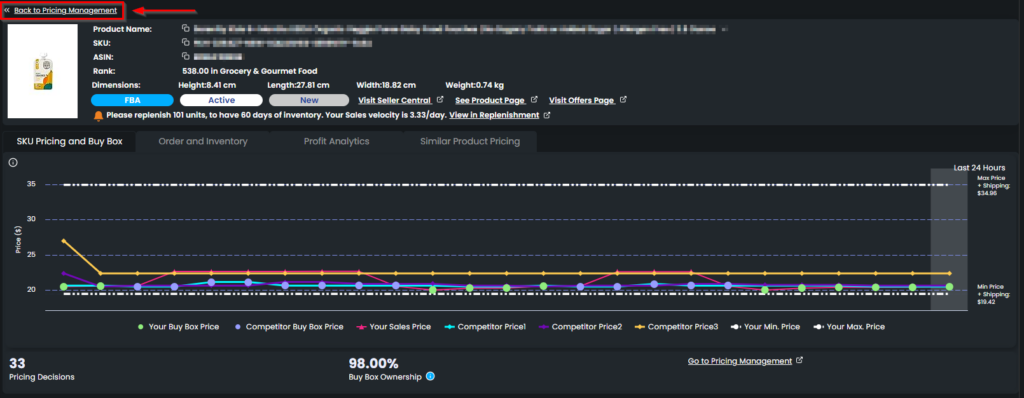
You can use “Back to Pricing Management” to go back to leave the “Pricing Actions and Analytics” card. Please see Figure 8 below.
Down below, there are four tabs and each of them gives SKU-related information on a particular aspect.
The “SKU Pricing and Buy Box” tab contains information about the pricing actions taken by Eva and compares them against the buy box price, your minimum and maximum price, the competitors’ prices and so on. Please see Figure 9 below.
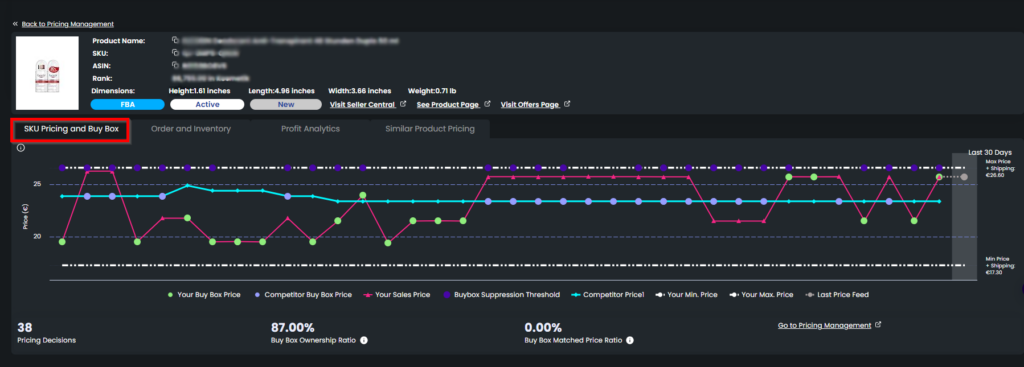
To read further on “SKU Pricing and Buy Box“, please click the button below.
The “Order and Inventory” chart gives a deeper insight into the inventory status and a number of sales etc. Please see Figure 10 below.
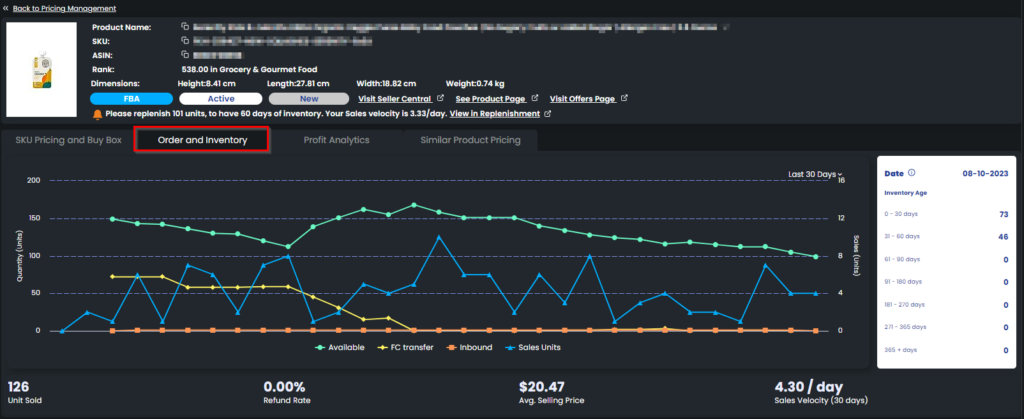
To read further on “Order and Inventory“, please click the button below.
The “Profit Analytics” chart gives a deeper insight into the profitability of the SKU by presenting sales, profit, costs, and fee information in the form of daily data. Please see Figure 11 below.
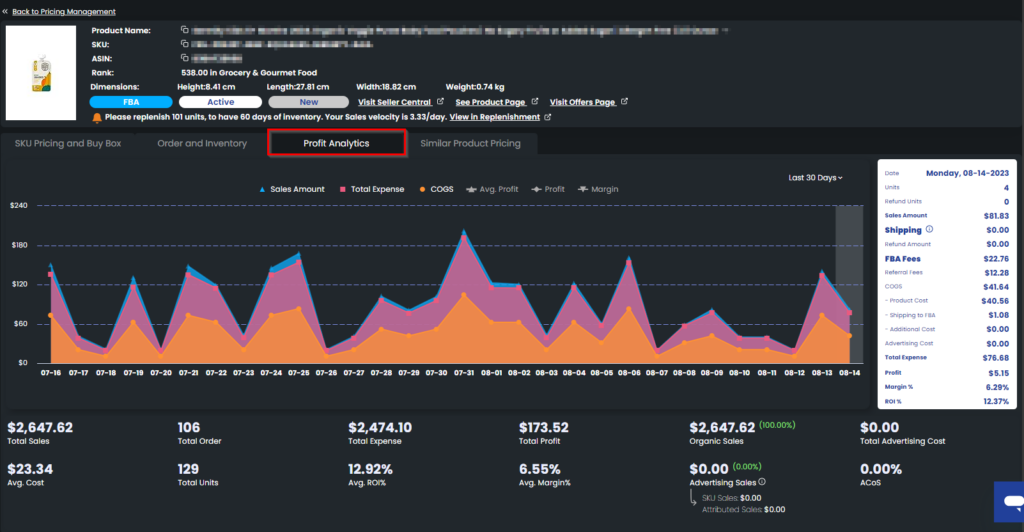
To read further on “Profit Analytics“, please click the button below.
“Similar Products Pricing” is a feature that enables you to monitor and compete with products that have different ASINs but are similar to your product. Please see Figure 12 below.
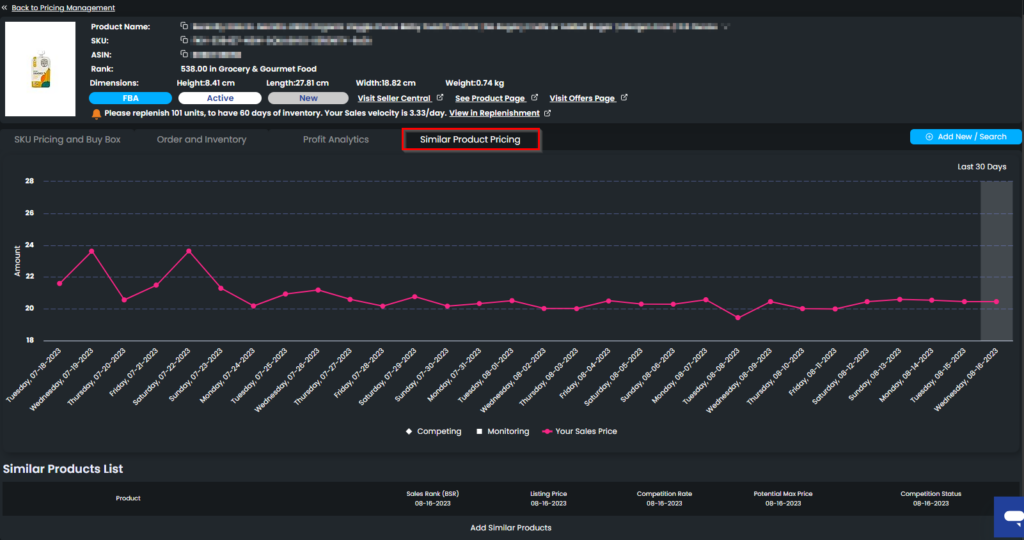
NOTE: If the competitor is above/below 50% of our product, Eva will act as a Single Offer.
To read further on “Similar Products Pricing“, click the button below.
NOTE: If a product is out of stock, that means Amazon does not send any price change notification and Eva can not reprice the item. For Eva to reprice your product, make sure that it is in stock!