Year over Year Sales (YoY Sales)
Since most industries experience seasonal fluctuations in sales through the year, year-over-year (YOY) comparisons are widely used when assessing a company’s performance to account for the impact of seasonality.
That’s where the YoY (Year over Year) Daily Sales section on Eva comes in. This page allows Brands (Private Labels) to compare their sales on the same day to the year before. By using this data you can gain insight into the growth trend of your business while not being thrown off by seasonal trends and special days. As an example, you can check your sales rates on Valentine’s Day for both this year and the previous year and compare the data.
In order to have access to your YoY Daily Sales, you must first hover to the “Operations Center” and then click on the “YoY Daily Sales” button. This chart allows you to analyze your sales and compare them annually in detail. Please see Figure 1.
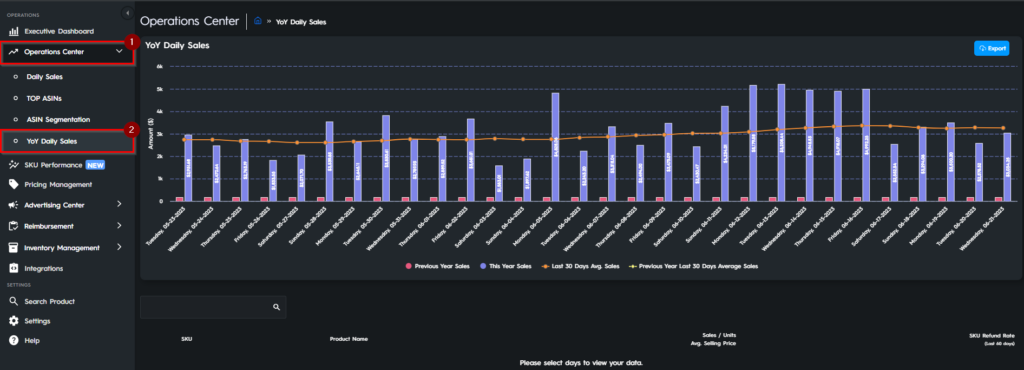
In this page, you can see your Previous Year Sales, This Year Sales and Last 30 Days Avg. Sales.
It is a two-axis chart and both are explained below.
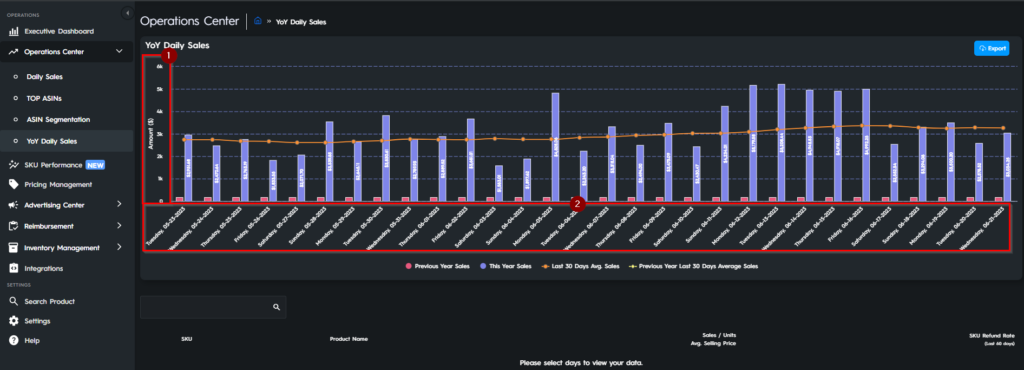
Axis 1: This axis displays the amount that you earned through your sales.
Axis 2: This axis displays the historical data.
Here, you will have all the access to YoY features.
If you click on one of the candles, you will have access to the menu that will open below. Please see Figure 3 below:
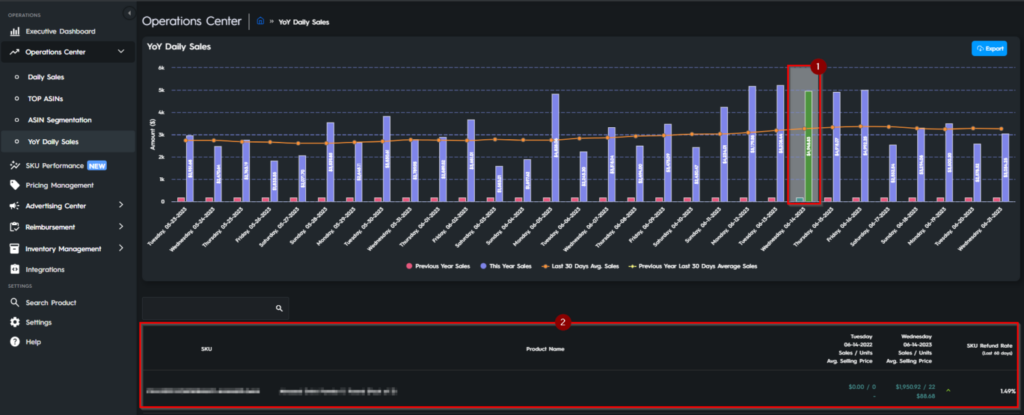
Here, you can see which SKUs you have enabled on that specific day, the sales rates and the refund rates of those SKUs.
If you want to search specific SKUs or other parameters, you can write them in the search box and click enter to apply your preferred filters.
Furthermore, clicking on those SKUs will redirect you to the Pricing Actions and Analytics page so that you can check all the detailed information about your SKU.
You can click here for more information about the Pricing Actions and Analytics page.