Reimbursement Analytics
When you open the reimbursement page, three or two cards are welcoming you, depending on whether you are a current Eva reimbursement customer or not.
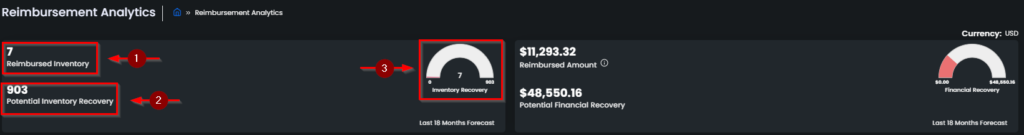
1. The first card is present for every account on Eva. The information displayed on it is as below:
Reimbursed Inventory represents the number of the inventory that has been reimbursed so far in the last 18 months. Please see arrow 1 in Figure 1 below.
Potential Inventory Recovery represents the number of the inventory that is likely to be reimbursed based on the last 18 months data. Please see arrow 2 in Figure 1 below.
The Inventory Recovery Indicator, which is on the right side of the card, illustrates how many of the Potential Inventory Recovery has been reimbursed so far. Please see arrow 3 in Figure 1 below.
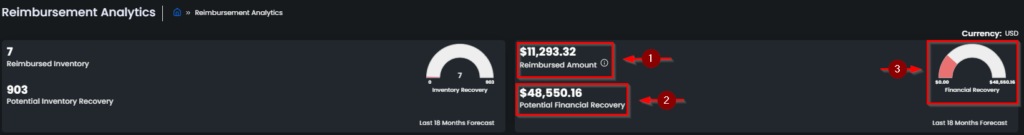
2. The second card is also present for every account on Eva. The information displayed on it is as below:
Reimbursed Amount represents the total monetary amount that is reimbursed in the last 18 months. This amount is the reimbursed amount acquired by claiming reimbursement cases. You can see this information by hovering over the info icon. Please see arrow 1 in Figure 2 below.
Potential Financial Recovery represents the estimated monetary amount that can be reimbursed. Please see arrow 2 in Figure 2 below.
The Financial Recovery Indicator, which is on the right side of the card, illustrates how much of the Potential Financial Recovery has already been reimbursed. Please see arrow 3 in Figure 2 below. Please see arrow 3 in Figure 2 below.
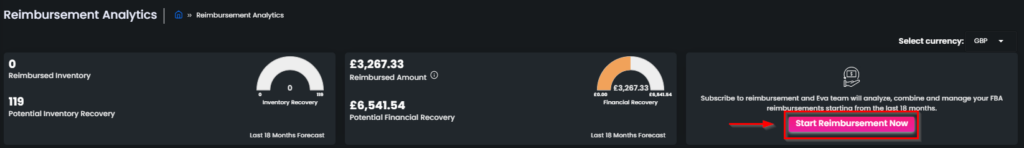
3. You will see the third card if you are not subscribed to the Eva reimbursement service. To start reimbursements, go and click on the Start Reimbursement Now button. We can take care of your reimbursement cases with a team of specialists, just make sure that you switched to a paid subscription package. Please see Figure 3 below.
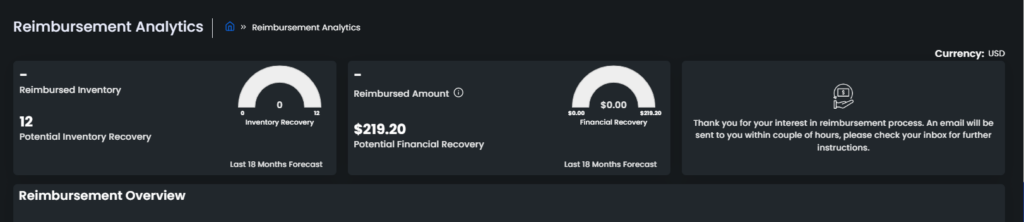
Once you click on the button, the request will be sent to the reimbursement team and they will contact you via e-mail within 24 hours, and the card will change and start to display this information. Please see Figure 4 below.
Reimbursement Overview
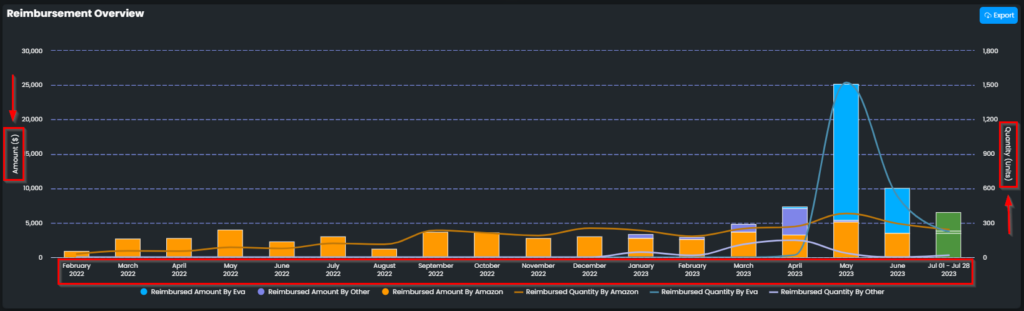
The reimbursement Overview chart displays the Reimbursed Amount and Reimbursed Quantity information over the maximum last eighteen months.
It is a three-axis chart and each one is explained below.
Axis 1: This axis demonstrates the monetary amount in the currency of the marketplace of the store. You can see which currency is used in the brackets. Please see arrow 1 in Figure 5 below.
Axis 2: This axis demonstrates the historical data. All these data are batched on monthly basis. All the months for which you have reimbursement data over the last eighteen months are displayed on the chart. Please see arrow 2 in Figure 5 below.
Axis 3: This axis demonstrates information on quantity based on units. Please see arrow 3 in Figure 5 below.
It is an interactive chart. When you hover over a month, a pop-up text will appear, on which you can see the details of Reimbursed Amount by Eva, Reimbursed Amount by Other, Reimbursed Amount by Amazon, Reimbursed Quantity by Amazon, Reimbursed Quantity by Eva and Reimbursed Quantity by Other for the chosen month. Please see Figure 6 below.
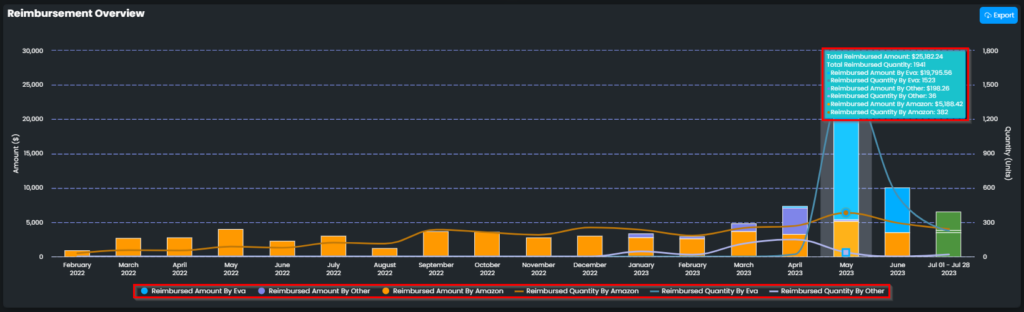
The Reimbursement Overview chart is directly connected to the Reasons pie chart, which gives a deeper insight into the types of reimbursement cases for the chosen month. To be directed to the related Reasons chart, go and click on a month.
Reimbursement Reasons Chart
Reimbursement Reasons pie chart displays and gives a deeper insight into the types of reimbursement cases for a chosen month.
The types of reimbursement cases are plotted on the pie chart and their monetary amount is listed on the right side. Please see Figure 7 below.
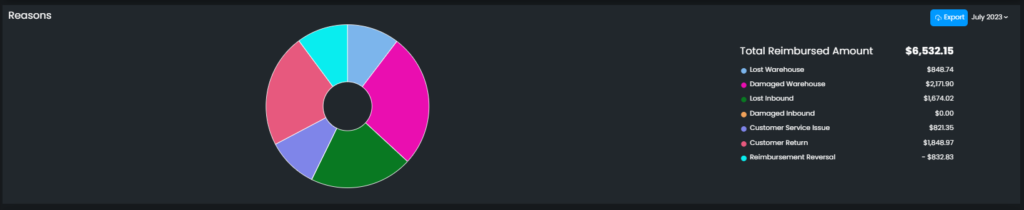
We open cases for across 26+ category types including Lost Warehouse, Lost Inbound, Damaged Inbound, Damaged Warehouse, Destroyed Warehouse, FBA Remeasurement, and many more.
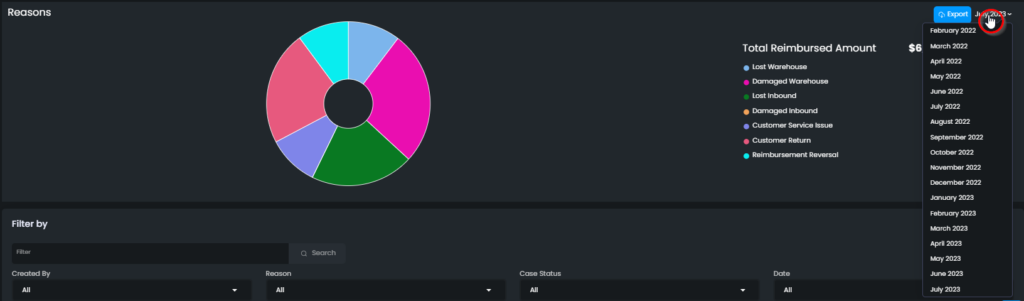
It is possible to change the time range from the drop-down menu on the upper right side. To do so, go and hover on the time range; a dropdown menu will appear, from which you can choose the time range. Please see Figure 8 below.
There is a color guide for the chart, each color represents a specific case type, which you can see next to the name of the outgoes.
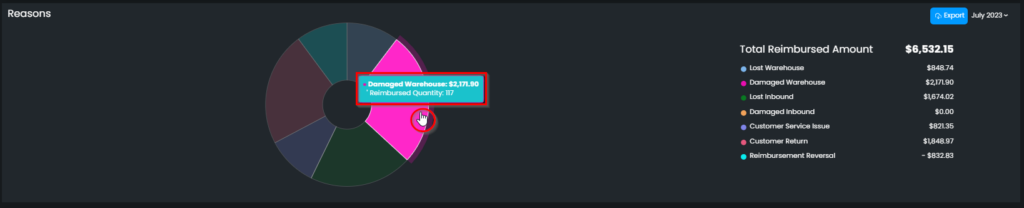
On the pie chart, you can go and hover over a specific color and a pop-up text will appear. The pop-up text shows what this part of the chart stands for, and also the reimbursed amount and quantity of the represented case. The rest of the cases will be thrown out of focus. Please see Figure 9 below.
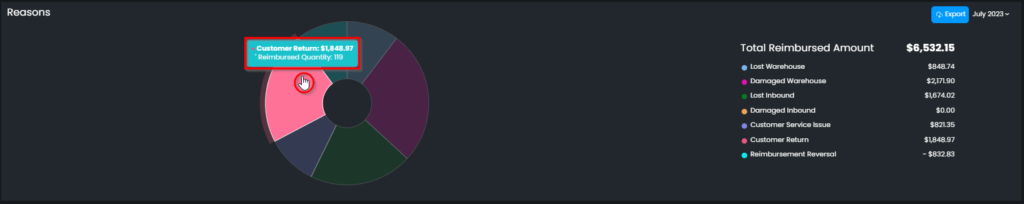
You can also check a specific case by hovering over the name of the case in the list and the related pie will be emphasized on the pie chart and the rest will be thrown out of focus. Please see Figure 10 below.
Filter Section
Filter By:
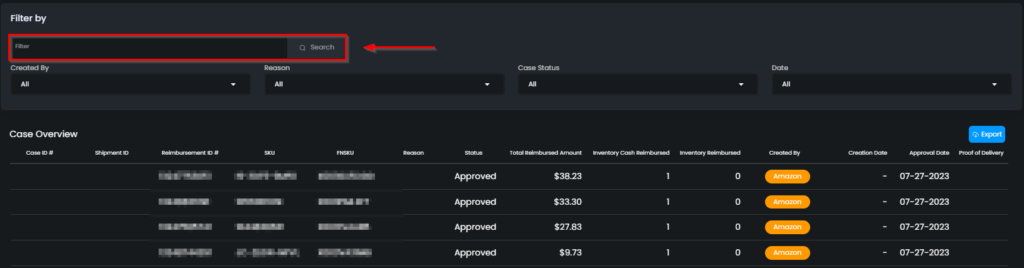
This is the area where you can input the Case ID, or Reimbursement ID to review the specific case overview that you are looking for. Please see Figure 11 below.
Created By:
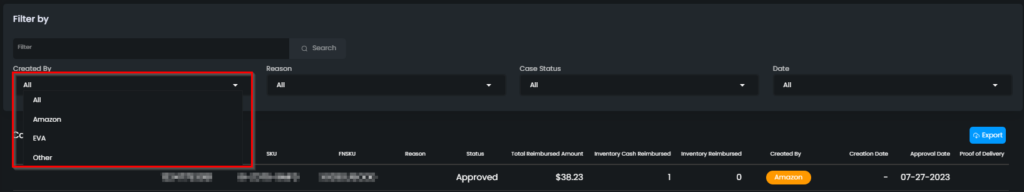
This filter option allows you to display cases by the creators’ information. You can select Amazon (cases created by Amazon), Eva (cases created by Eva), Other, or All options from the drop-down list. Please see Figure 12 below.
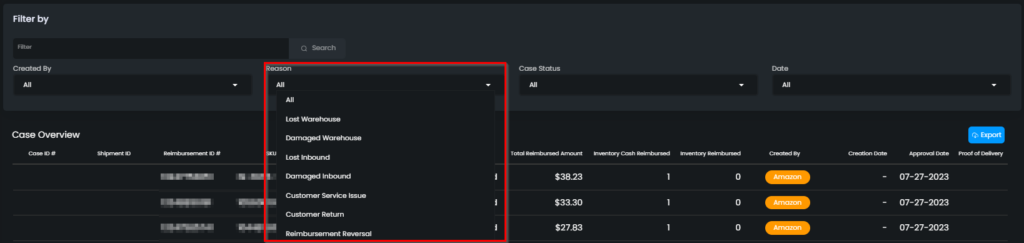
Reason:
This area allows you to filter the cases by the reimbursement reasons. You can select the relevant reason from the dropped-down list such as: All, Lost Warehouse, Damaged Warehouse, Lost Inbound, Customer Service Issue, Customer Return, or Reimbursement Reversal. Please see Figure 13 below.
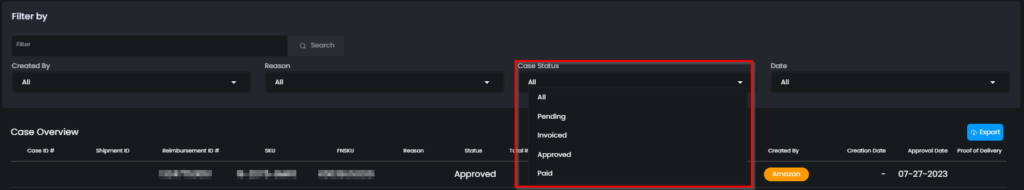
Case Status:
This is the area where you can display your cases’ statuses by filtering. You can select the case status from the dropped-down list as: All, Pending, Invoiced, Approved, or Paid. Please see Figure 14 below.
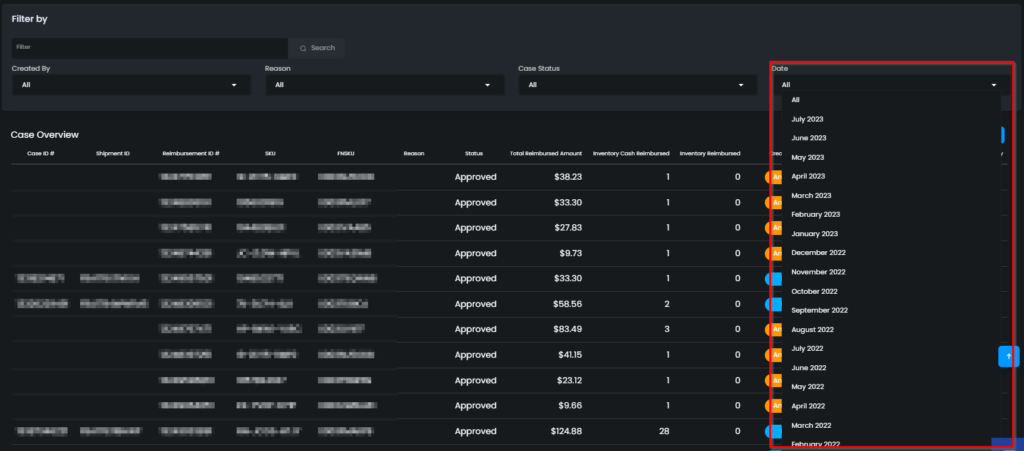
Date:
Date filter allows you to display cases by their selected date information monthly. You can filter the cases by selecting a specific month. Please see. Please see Figure 15 below.
Reimbursement Case Overview
A case overview is a detailed list of reimbursement cases that have been claimed in the last sixty days.
The cases are listed with detailed information which respectively is Case ID, Reimbursement ID, Status, Total Reimbursed Amount, Inventory Cash Reimbursed, Inventory Reimbursed, Filed by, Filed Date, and Approval Date.
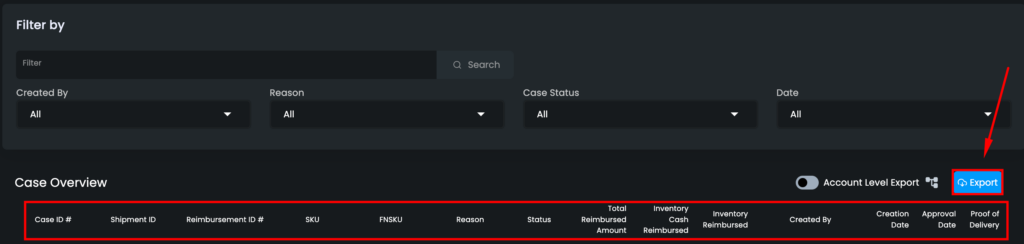
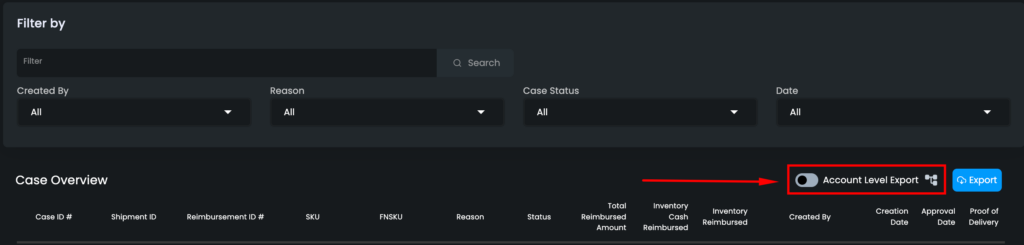
Case Overview Exporting Data:
When it comes to managing reimbursement cases on Amazon, having access to comprehensive data exports is crucial for a thorough case overview. Thankfully, Eva offers two convenient ways to export the necessary information. The first method involves the standard exporting feature, which provides all the regular details, such as status, reason, and product information. This export is perfect for getting a general overview of the reimbursement case. However, for sellers who require a deeper analysis, the account level export is the ultimate solution. This export goes above and beyond, furnishing marketplace details for multiple regions, enabling sellers to understand regional variations and assess the impact on their business.
Both the account level export and the export button serve distinct purposes in a reimbursement case overview. While the account-level export offers a broader perspective, encompassing regional data and marketplace details, the export button provides precise insights into individual product data. Combining the information from both exports equips you with the necessary tools to investigate and resolve reimbursement cases effectively. See the Figures 16 and 17
Most Reimbursed Items
The most twenty reimbursed items in the last eighteen months by their value and by the quantity have been listed.
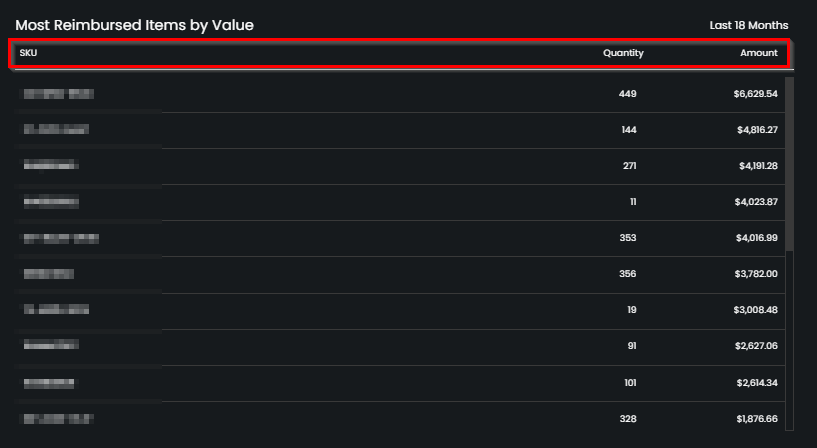
Most Reimbursed Items by Value
Twenty items that have been the most reimbursed by value in the last eighteen months are listed with their SKU, Quantity, and Amount. Please see Figure below. You can use the scrollbar to scroll up and down to see all the SKUs.
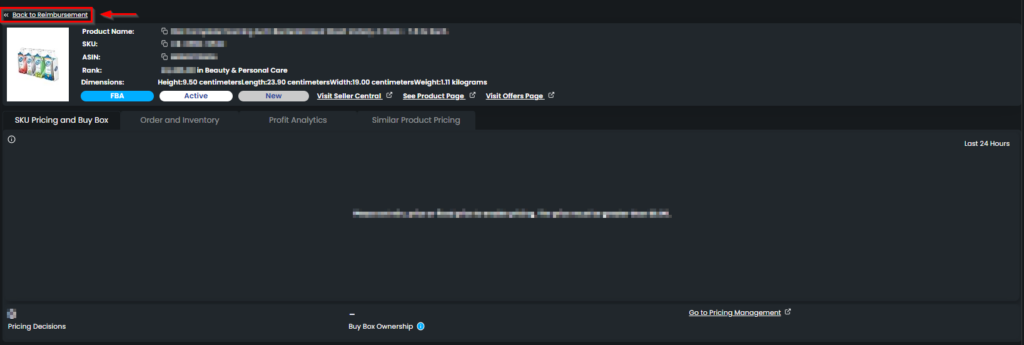
It is possible to check the Pricing Actions and Analytics card of each SKU listed. To do so, go and click on an SKU, and the related Pricing Actions and Analytics card will pop up. Please see Figure 18 above.
To go back to the reimbursement page, go and click on Back to Reimbursement on the upper left side. Please see the arrow in Figure 19 below.
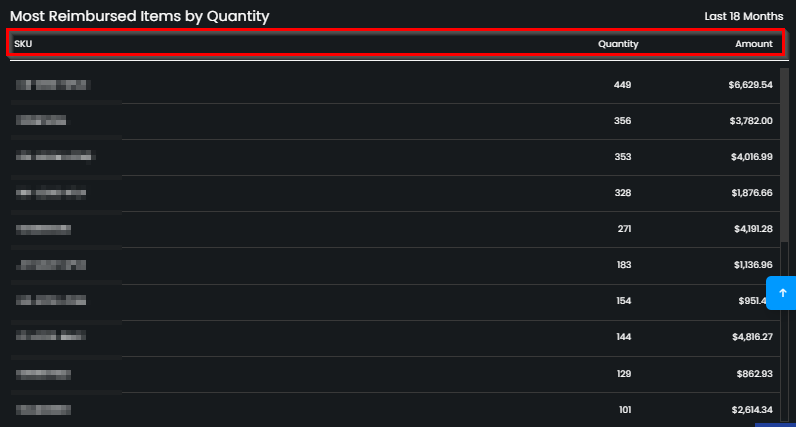
Most Reimbursed Items by Quantity
Twenty items that have been the most reimbursed by their quantity in the last eighteen months are listed with their SKU, Quantity, and Amount. Please see Figure 20 below. You can use the scrollbar to scroll up and down to see all the SKUs.
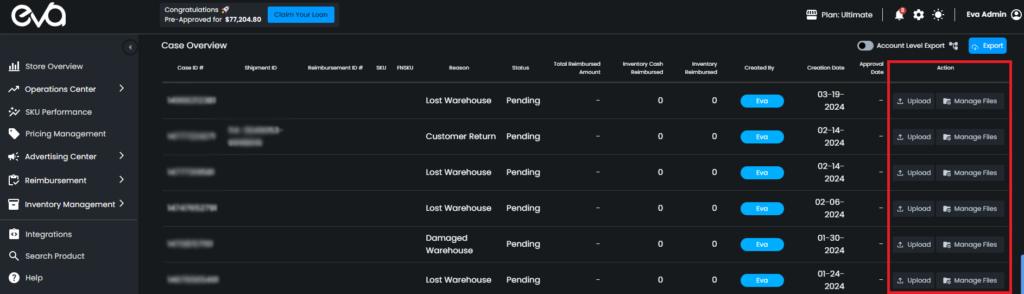
File Management
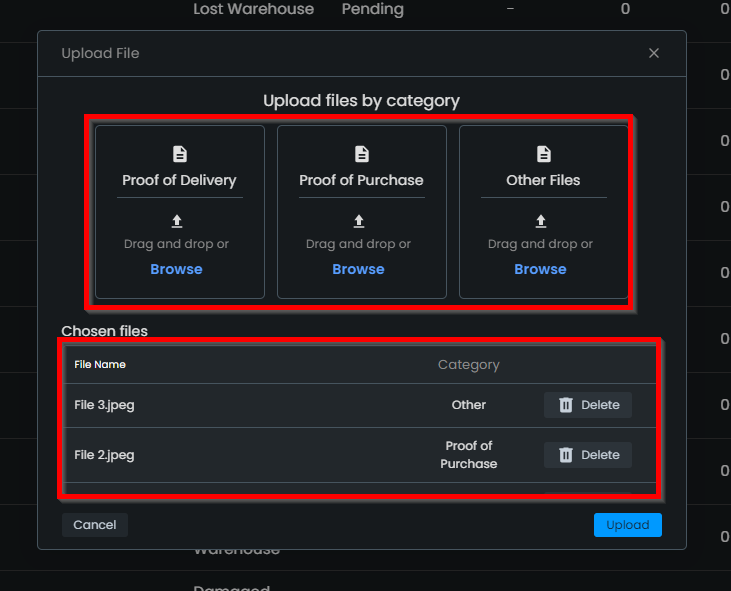
For some cases, you need to upload “Proof of Delivery“, and “Proof of Purchase“, and you might need “Other Files” to upload you can select the files you want to add by category.
Once you’ve selected your files, a list will appear showing the files you’ve chosen.
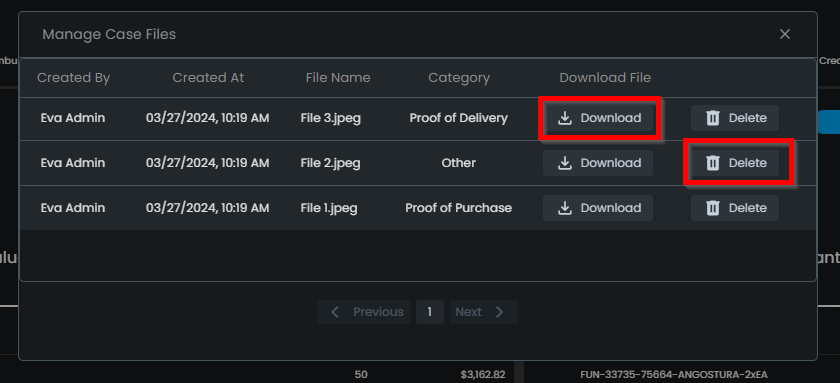
After uploading your files, you have the option to manage them. Use the ‘Manage Files‘ button to:
Download: Retrieve your uploaded files whenever you need them.
Delete: Remove any unnecessary or outdated files from the system.
To learn more about Eva Reimbursement services, you can click on the following link.
Ready to Elevate Your Success? Book a call with our experts—just enter your email below to get started!