Management Insights: Order-Based Profit Report
This feature allows you to download detailed order-based sales and expense data directly from the Store Overview page in MS Excel format, and now also in Google Sheets. Here’s everything you need to know to make the most of this powerful tool.
How to Access and Use the Export Feature
Downloading the Exported File
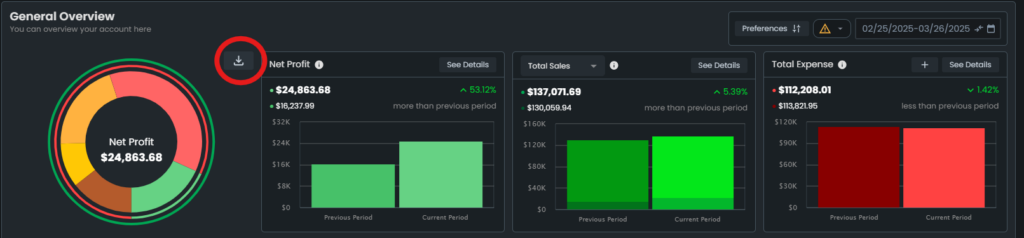
- Navigate to the Store Overview page.
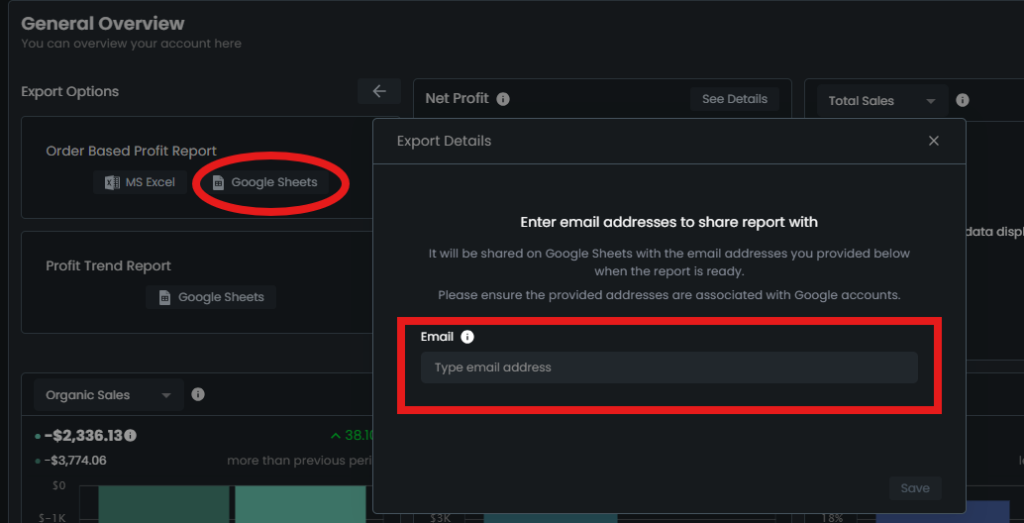
- Locate the export buttons at the right corner of the Donut Charts on the Profit and Amazon Payout cards.
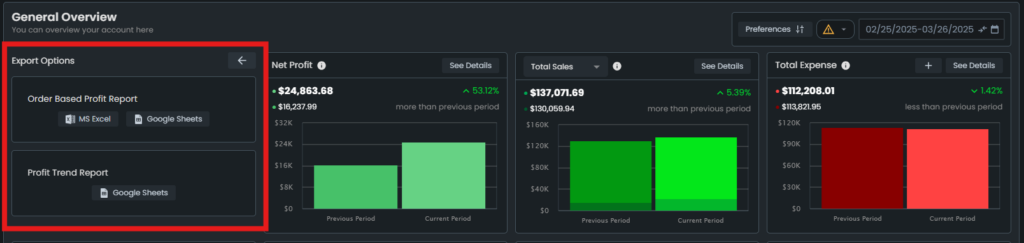
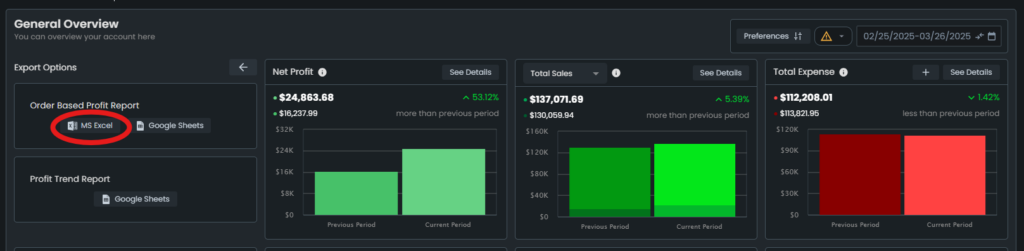
- Select your preferred format: “Export as MS Excel” or “Export as Google Sheets.”
- For Google Sheets, provide the email addresses associated with Google accounts to share and authorize viewing.
Viewing the Excel File
- Download the file from the Store Overview page.
- The downloaded file will be in the Operations Center > Reports page.
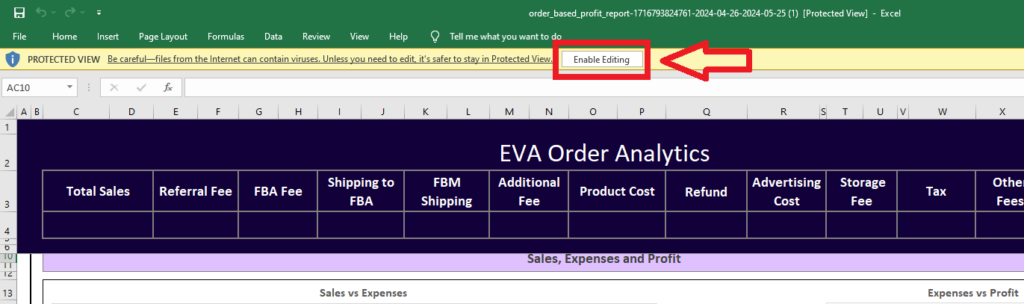
- Once downloaded, click “Enable Editing” to access the detailed data.
Viewing the Google Sheets File
- Follow the prompts to share the Google Sheets file with the provided email addresses.
- Access the file through the shared link sent to your email.
- The downloaded file will be in the Operations Center > Reports page.
Understanding the Exported Data
Order Based Profit Report
The exported file includes two tabs: Analytics and Source Data.
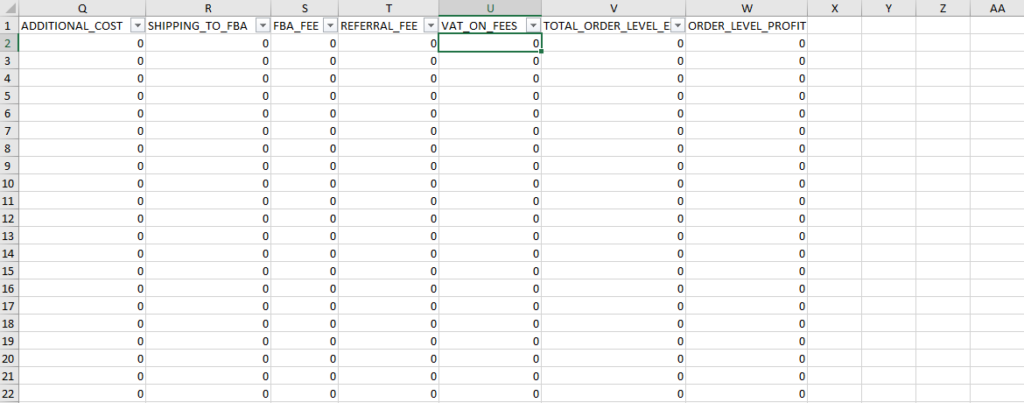
Source Data Tab
This tab contains detailed sales and expense information for each order, providing a comprehensive overview of your store’s financials.
Here, you’ll find detailed sales and expense information for each order, including Amazon Order ID, Purchase Date, ASIN, SKU, Order Status, Item Status, Quantity, Principal Amount, Tax Amount, Shipping Amount, FBA/FBM breakdown, Product Cost, FBM Shipping, Additional Cost, Shipping to FBM, FBA Fee, Referral Fee. It also includes Store Level Advertising Cost, Total Storage Fee, and Other Store Level Fees to calculate profit in the selected period.
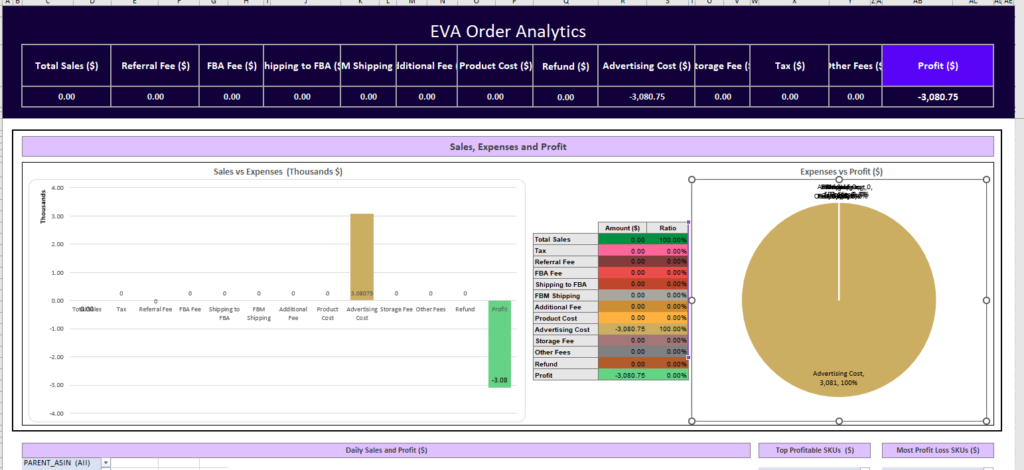
Eva Order Analytics Tab
This tab provides a summarized and visualized representation of your sales, expenses, and profit information for the selected period. Key features include:
- Charts: Two types of charts that provide visual insights into your financial data.
- Pivot Tables: Filterable pivot tables that allow you to drill down into specific data points. These include:
- Daily Sales and Profit: Daily breakdown of sales and profit.
- Top Profitable ASINs: List of the most profitable products.
- Most Profit Loss ASINs: List of products with the highest loss.
These tools are designed to give you deeper insights into your sales and expenses, enabling you to make informed decisions and grow your business effectively.
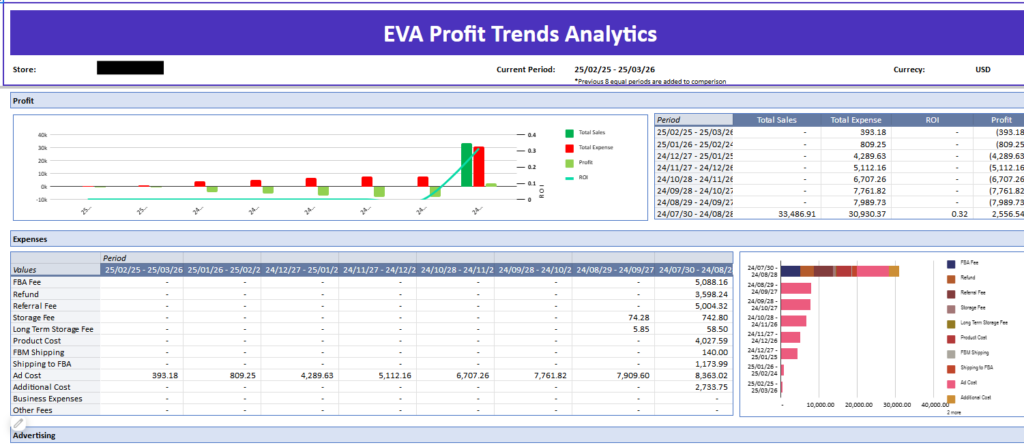
Profit Trend Report
This report consists of details and analysis about your profit. This includes the following data:
- Profit in a selected period
- Expenses
- Advertising
- PPC
- DSP
“Ready to Elevate Your Success? Schedule a call with our experts today – simply click this link and choose a time that works best for you!”