Eva’s Trend Analytics: Unlocking Real-Time Insights for Smarter Decision-Making
Tracking store performance on a daily basis is crucial for staying ahead in the competitive Amazon marketplace. Eva’s Trend Analytics page provides sellers with a real-time, data-driven dashboard that consolidates store-wide performance metrics, advertising data, and product-specific trends into an intuitive and actionable interface. With advanced filtering options, dynamic visualizations, and a customizable data table, the Trend Analytics page is designed to simplify decision-making and optimize store performance.
Let’s explore the key features and benefits of Eva’s Trend Analytics page.
1. Advanced Filtering Options
The Trend Analytics page allows users to refine their data using powerful filtering options, making it easier to focus on specific products, performance metrics, or time periods.
Searching & Filtering Products
- Users can search products by name or utilize advanced filtering for more precise insights.
- The filtering system will soon include a “Favorites” feature, allowing users to save frequently used filters for quick access.
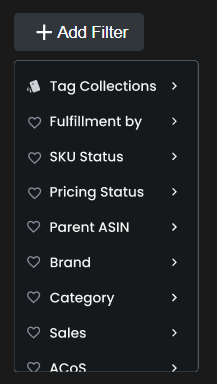
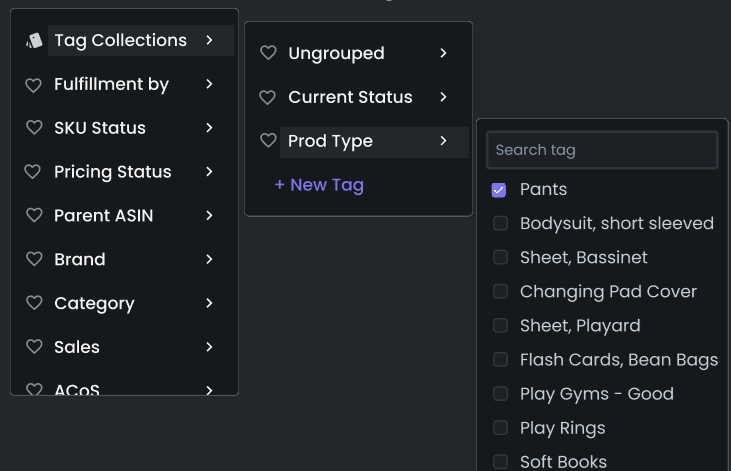
Tag-Based Filters: Custom Organization
- Users can assign custom tags to products to group them by specific attributes (e.g., seasonal items, promotions, bestsellers).
- New tags can be created on the fly, giving users the flexibility to adjust filtering as their priorities change.
Category, Brand & Product Info Filters
- Advanced filtering includes Category, Brand, Parent ASIN, Fulfillment Type, SKU information, and Inventory data.
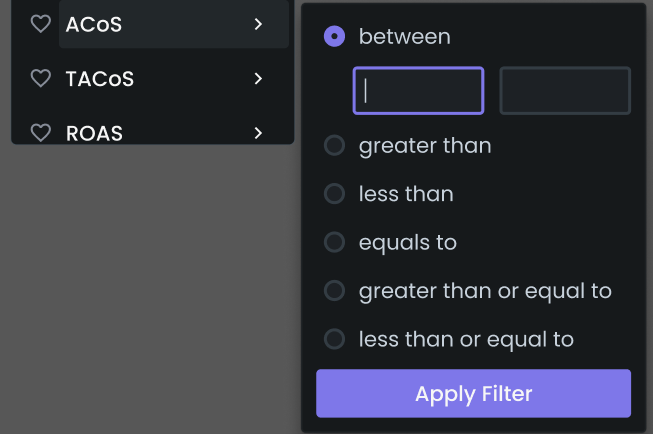
- Filters also cover advertising and total performance metrics, including:
- Ad Sales, Organic Sales, Total Orders, ROI, ROAS, TACoS, ACoS, Conversion Rates (CVR), CTR, CPC, Average Order Value (AoV), Refunds, and more.
- Users can apply operations such as greater than, less than, between, and equals to for precision filtering.
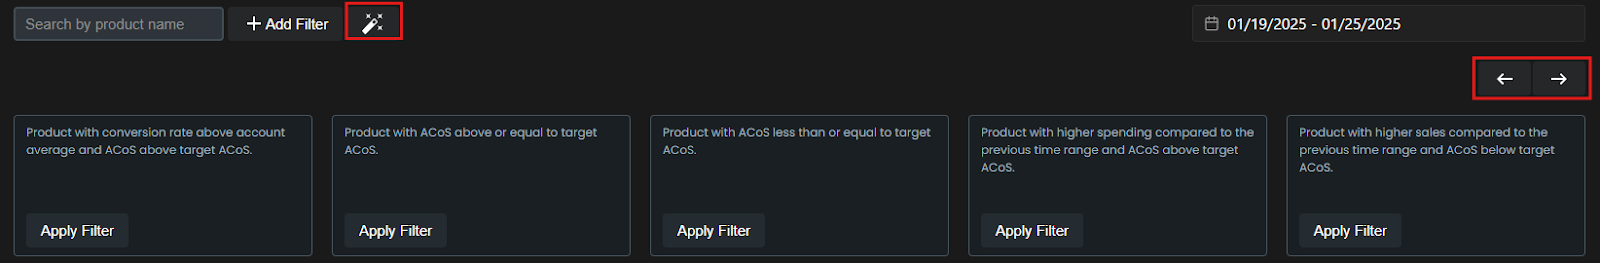
Smart Filters: AI-Powered Analysis
- Smart Filters enable quick analysis of product performance based on advertising effectiveness and overall sales.
- Users can apply predefined queries such as:
- Products with no ad spend.
- High-performing or underperforming SKUs.
- Products exceeding ACoS targets.
- If a store lacks an advertising connection, users will be prompted to connect their ad account to enable these filters.
Selecting a Time Frame
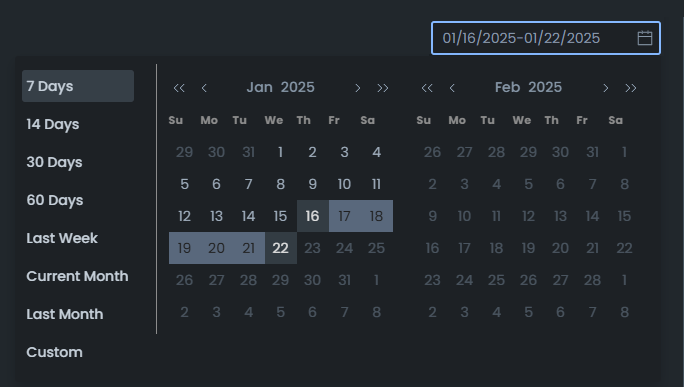
- The date picker allows users to analyze data over daily, weekly, monthly, or custom time periods.
- Options include Last 7, 14, 30, or 60 days, Last Week, This Month, and Previous Month.
- Users can compare performance trends over selected periods.
2. Dynamic Chart Visualization
This section provides an interactive, real-time graphical representation of performance trends, helping sellers track changes and make data-driven decisions quickly.
Legend Cards: Instant Insights
- Up to four key metrics can be displayed simultaneously, selected from a list of over 20 performance indicators.
- Legend Cards above the chart display aggregated values, tooltips, and color coding for easy differentiation.
- Users can remove or replace metrics instantly, tailoring the chart to their needs.
Dynamic Chart: Track Trends Over Time
- The chart automatically adjusts based on the selected time frame.
- If data covers more than 56 days, the chart switches to a weekly view for easier interpretation.
- Users can compare advertising and organic performance metrics side-by-side.
Advertising Data & Seasonal Analysis
- Advertising-related metrics require a connected Amazon Ads account. If unavailable, these metrics will appear locked with a prompt to connect the account.
- The “Seasonal Days” toggle enables users to highlight major sales events (e.g., Prime Day, Black Friday) and analyze their impact on store performance.
Export & Expand Options
- Users can export chart data with a single click.
- The expand/collapse button allows for toggling between detailed views and a simplified summary mode.
3. Advanced Data Table: A Deep Dive into SKU Performance
The Trend Analytics Data Table provides a granular, product-by-product analysis of performance metrics, enabling sellers to track sales, advertising efficiency, and inventory trends with ease.
Comprehensive Performance Metrics
- The table includes 30+ key performance indicators (KPIs) for each SKU, including:
- Total Sales, Ad Sales, Organic Sales, Orders, Units Sold, Profit, ROI, ACoS, TACoS, CPC, Conversion Rates, Inventory Levels, and more.
- Users can expand each product to view performance at the SKU level for a more detailed breakdown.
Sorting & Customization
- Columns are sortable, allowing users to prioritize products based on specific metrics.
- The “Column Options” button enables full customization, ensuring sellers focus only on relevant data.
Tagging Products for Better Organization
Managing product performance can be overwhelming, especially when dealing with a large inventory. Eva’s tagging system makes it easy to organize, track, and analyze products and SKUs by assigning meaningful tags that categorize them based on specific criteria such as promotions, seasonality, bestsellers, or advertising goals.
Adding and Managing Tags
- Each product and its associated SKUs can have multiple tags to facilitate better segmentation and filtering.
- To add a tag to a product or SKU, click the “+ Add Tag” button in the Tags column.
- A dropdown menu will appear, allowing users to:
- Select an existing tag.
- Create a new tag on the fly by typing a name and pressing Enter.
Bulk Tagging for Efficiency
- Users can select multiple products and apply the same tag to all selected items using the “Tag Selections” button at the top right of the table.
- This feature is particularly useful for categorizing entire product groups quickly, such as identifying low-performing SKUs or grouping items under a marketing campaign.
Custom Tag Creation
- If the desired tag doesn’t exist, users can create a new one via the “Create Tag” dialog, where they can:
- Assign the tag to a collection for better organization.
- Choose a custom color for easy identification.
- Apply the tag across all stores under their account.
Editing & Removing Tags
- To edit or switch a tag, hover over it and click the switch (⇆) button, which allows users to replace the tag with another from the list.
- To remove a tag, hover over it and click the (X) button, detaching it from the product or SKU.
By leveraging Eva’s tagging system, sellers can streamline their product categorization, enhance filtering capabilities, and ensure precise tracking of key performance groups—ultimately making smarter, data-driven decisions with ease. 🚀
Inline Actions: Quick Navigation & Goal Setting
- “Details” Button: Redirects to the Product Detail Page, similar to the SKU Performance Detail Page.
- “Set Goals” Button: (Coming Soon) Allows sellers to set Advertising & Pricing Goals at both Product & SKU levels.
Export & Pagination for Large Data Sets
- The table displays 25 rows per page but allows full data export for detailed analysis.
Why Use Eva’s Trend Analytics?
Eva’s Trend Analytics page is designed for sellers who want quick, insightful, and actionable data at their fingertips.
Key Benefits:
✔ Save Time – Advanced filtering and Smart Filters streamline product analysis.
✔ Make Data-Driven Decisions – Real-time metrics and customizable charts enhance strategic planning.
✔ Track Advertising & Organic Sales Together – Understand the full picture of your store’s performance.
✔ Improve Organization – Use Tags and custom columns for better data segmentation.
✔ Identify Opportunities & Risks – Spot trends and underperforming SKUs before they impact profitability.
✔ Export & Share Reports – Download insights for deeper external analysis.
With Eva’s Trend Analytics, you gain the power to track performance trends, optimize strategies, and maximize your Amazon success—all in one place.
Ready to take control of your store’s daily performance? Start using Eva’s Trend Analytics today! 🚀