ASIN Performance
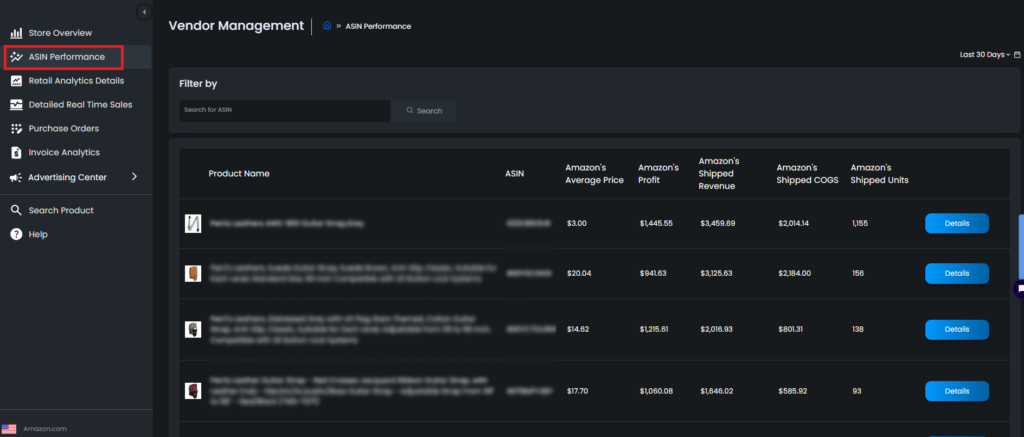
The ASIN Performance page gives deeper insight into performance of your products by providing the sale, profit and expense data for each ASIN. You can access this data by clicking ASIN Performance page at the right menu. Please see Figure 1.
On the page Product name, ASIN, Amazon’s Average Price, Amazon’s Shipped Revenue, Amazon’s Shipped COGS, Amazon’s Shipped Units are displayed. The date interval for this page can be set to any custom range by using the dropdown menu on the upper right corner of the screen.
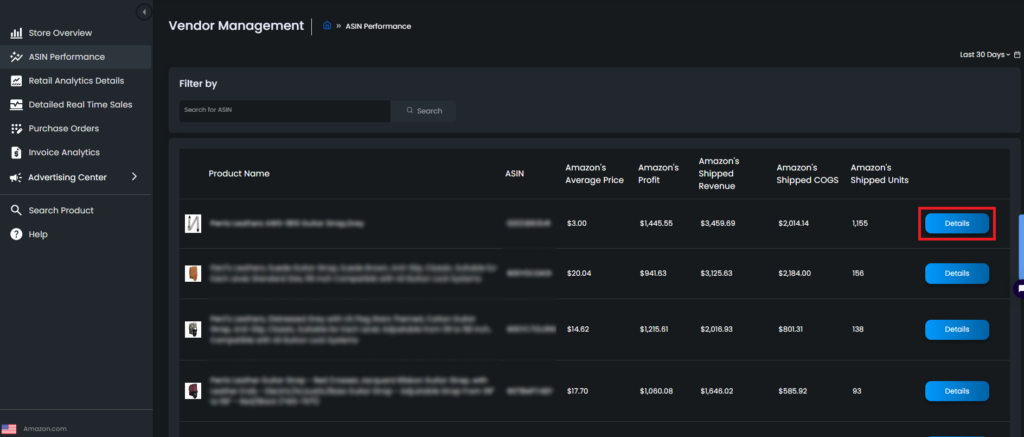
You can view detailed information on any of the ASINs by clicking the “Details” button at the right. Please see Figure 2.
Once you click details you will access a series of charts displaying detailed data. At the top you are greeted with the ASIN Performance Card which shows Average price, Shipped units, Amazon’s Shipped Revenue and Amazon’s Shipped COGS.

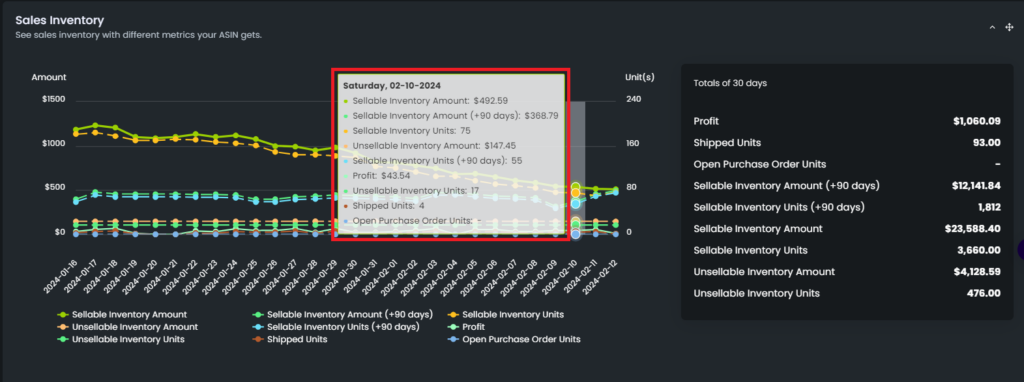
Below we have the Sales Inventory chart which displays daily data regarding the inventory amounts of the ASIN. You can hover onto a specific day to view that day’s data. Please see Figure 4.
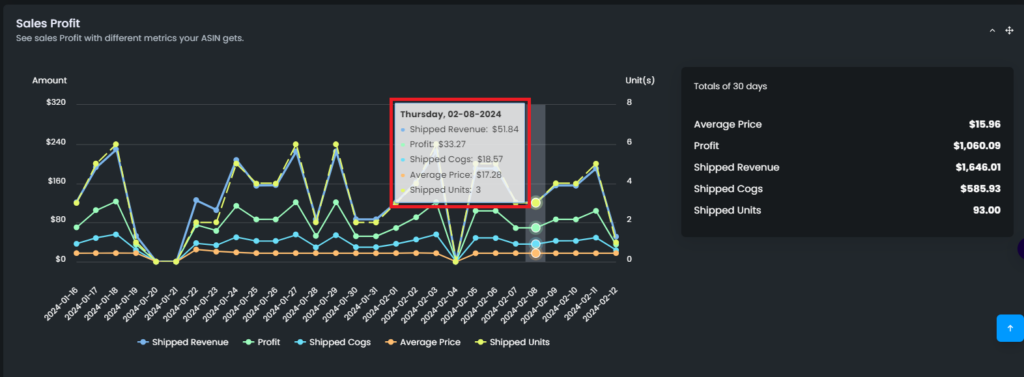
Next up is the Sales Profit chart, which displays daily sales, profit, and COGS data for the ASIN. You can again hover on to a specific day to view its data. See Figure 5.
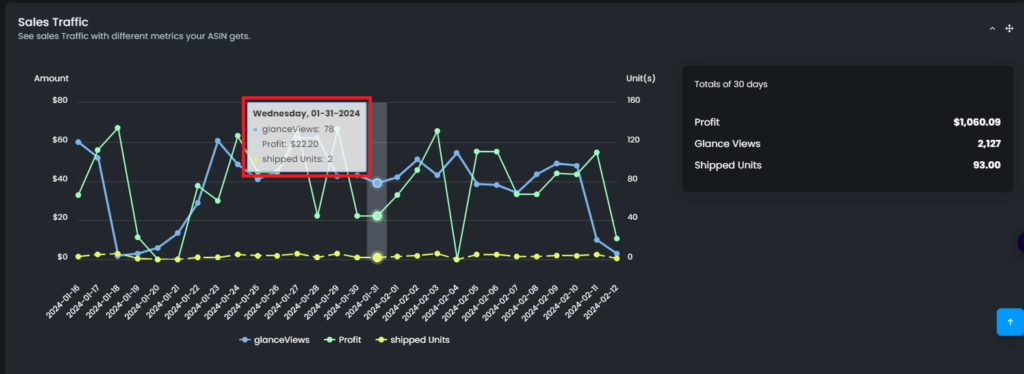
The Sales Traffic chart below displays the daily profit, glance views, shipped units data. See Figure 6.
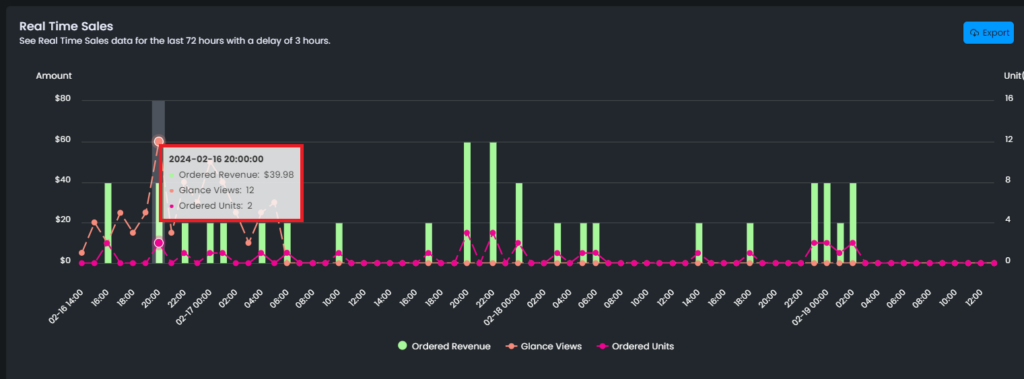
Real Time Sales Chart displays the sales data of the last 72 days with a 3 hour delay. See Figure 7.
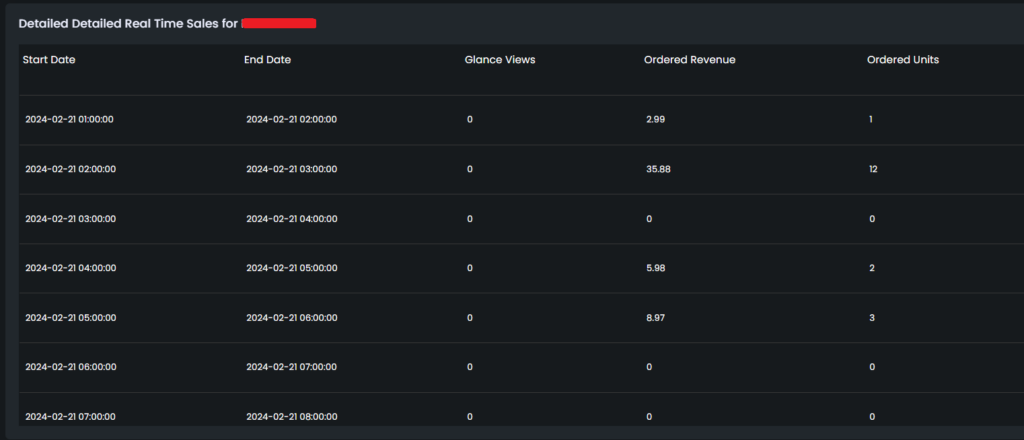
Detailed Real Time Sales table below contains details on the sales such as Start and End dates, Glance Views, Ordered Revenue, Ordered Units. See Figure 8.
“Ready to Elevate Your Success? Schedule a call with our experts today – simply click this link and choose a time that works best for you!”
