Retail Analytics Details
On the Retail Analytics page you can view two charts displaying the ordered revenue and shipped revenue data respectively. To access this page click the Retail Analytics Details button on the right menu as seen in Figure 1.
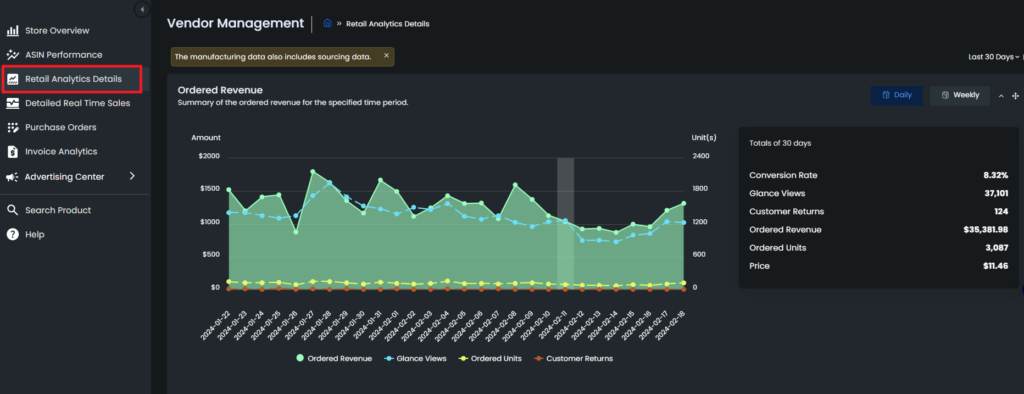
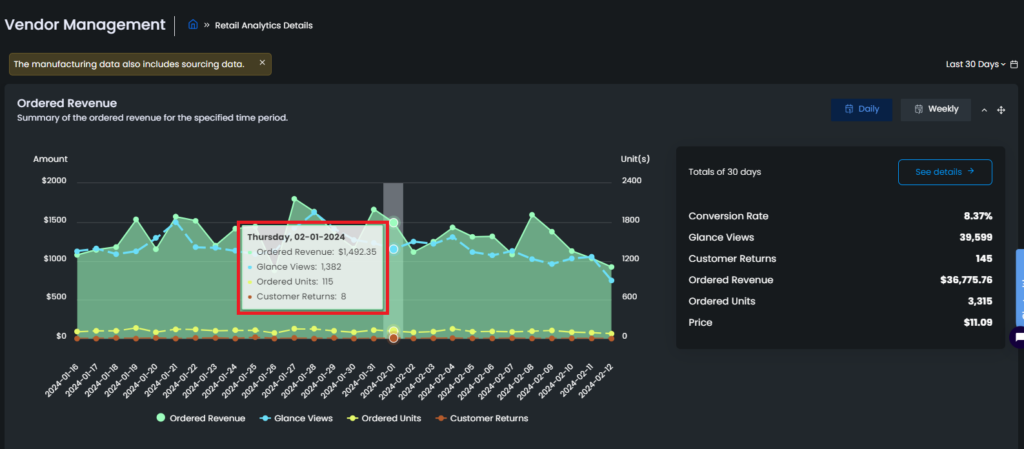
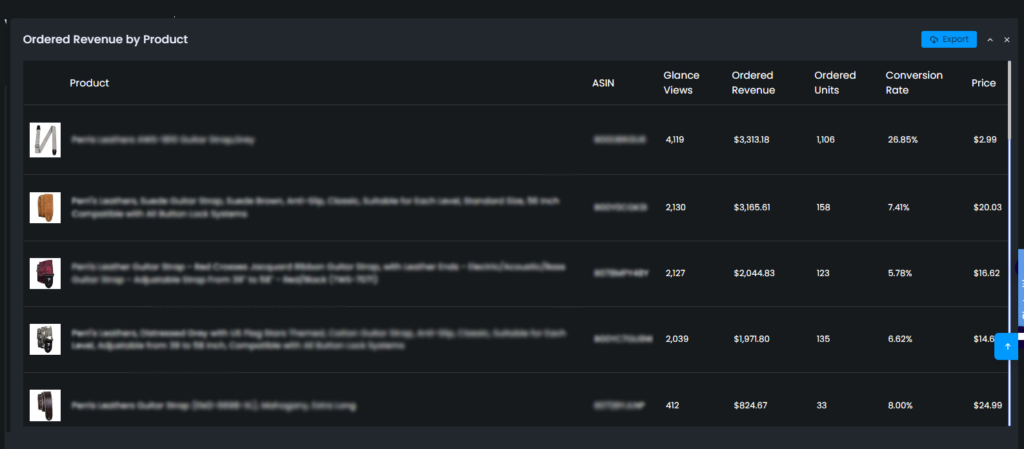
On the Ordered Revenue chart Ordered Revenue, Glance Views, Ordered Units, Customer Returns data are included and the Price is shown on the vertical axis. On the table at the right you can find the total of all metrics listed.
The graph can be set as weekly or daily from the Daily and Weekly buttons above. You can select a time interval such as the last 30, 60, 90 days and so on or set a custom interval by using the dropdown menu on the upper right corner.
Note: Please keep in mind that the manufacturing data also includes sourcing data.
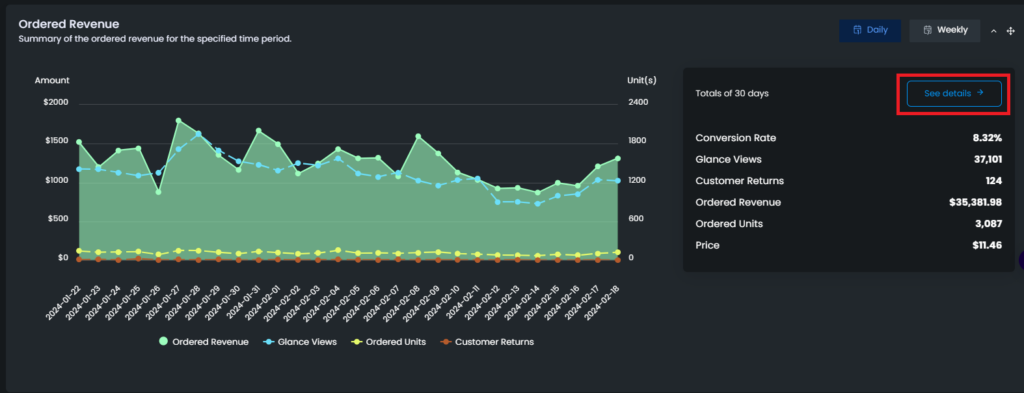
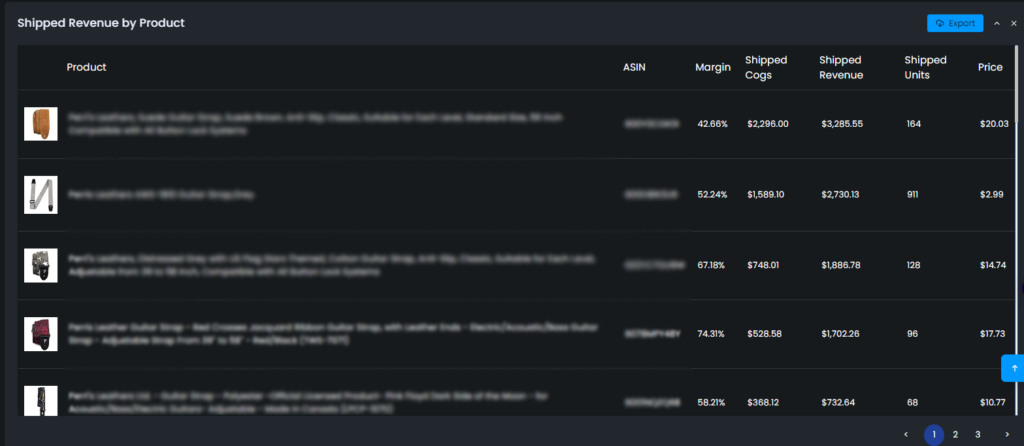
Click the See Details button to unlock the Ordered Revenue by Product table listing the data for all the products sold during the chosen time interval. You can export this table as an excel file by clicking the Export button on the upper right corner.
Below we have the Shipped Revenue chart, which includes Shipped Revenue, Shipped COGS, Shipped Units, Price, and Customer Returns data. On the table at the right you can find the total of all metrics listed as well as Average Shipped COGS and Margin.
The graph can be set as weekly or daily from the Daily and Weekly buttons above. You can select a time interval such as the last 30, 60, 90 days and so on or set a custom interval by using the dropdown menu on the upper right corner.
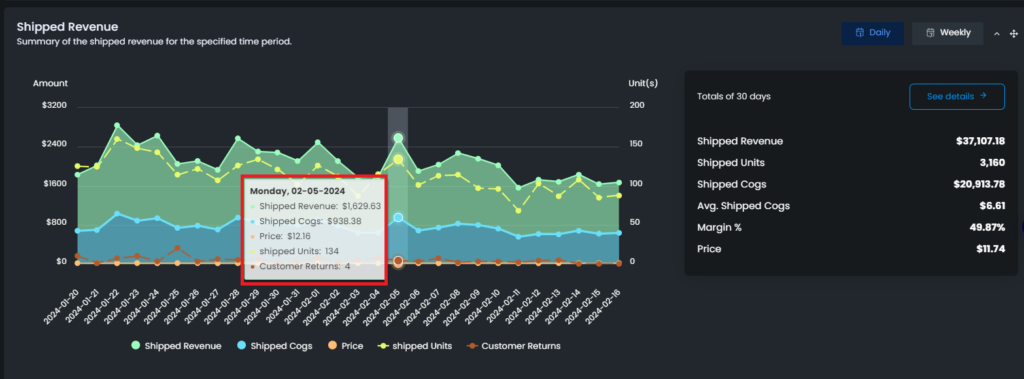
In the same way as the Ordered Revenue chart, a detailed table opens up when you click the See Details button. Shipped Revenue By Product table lists the data for all the products sold during the chosen time interval. You can export this table as an excel file by clicking the Export button on the upper right corner.