Trend Analytics: Trend Analytics Chart
Trend Analytics Chart
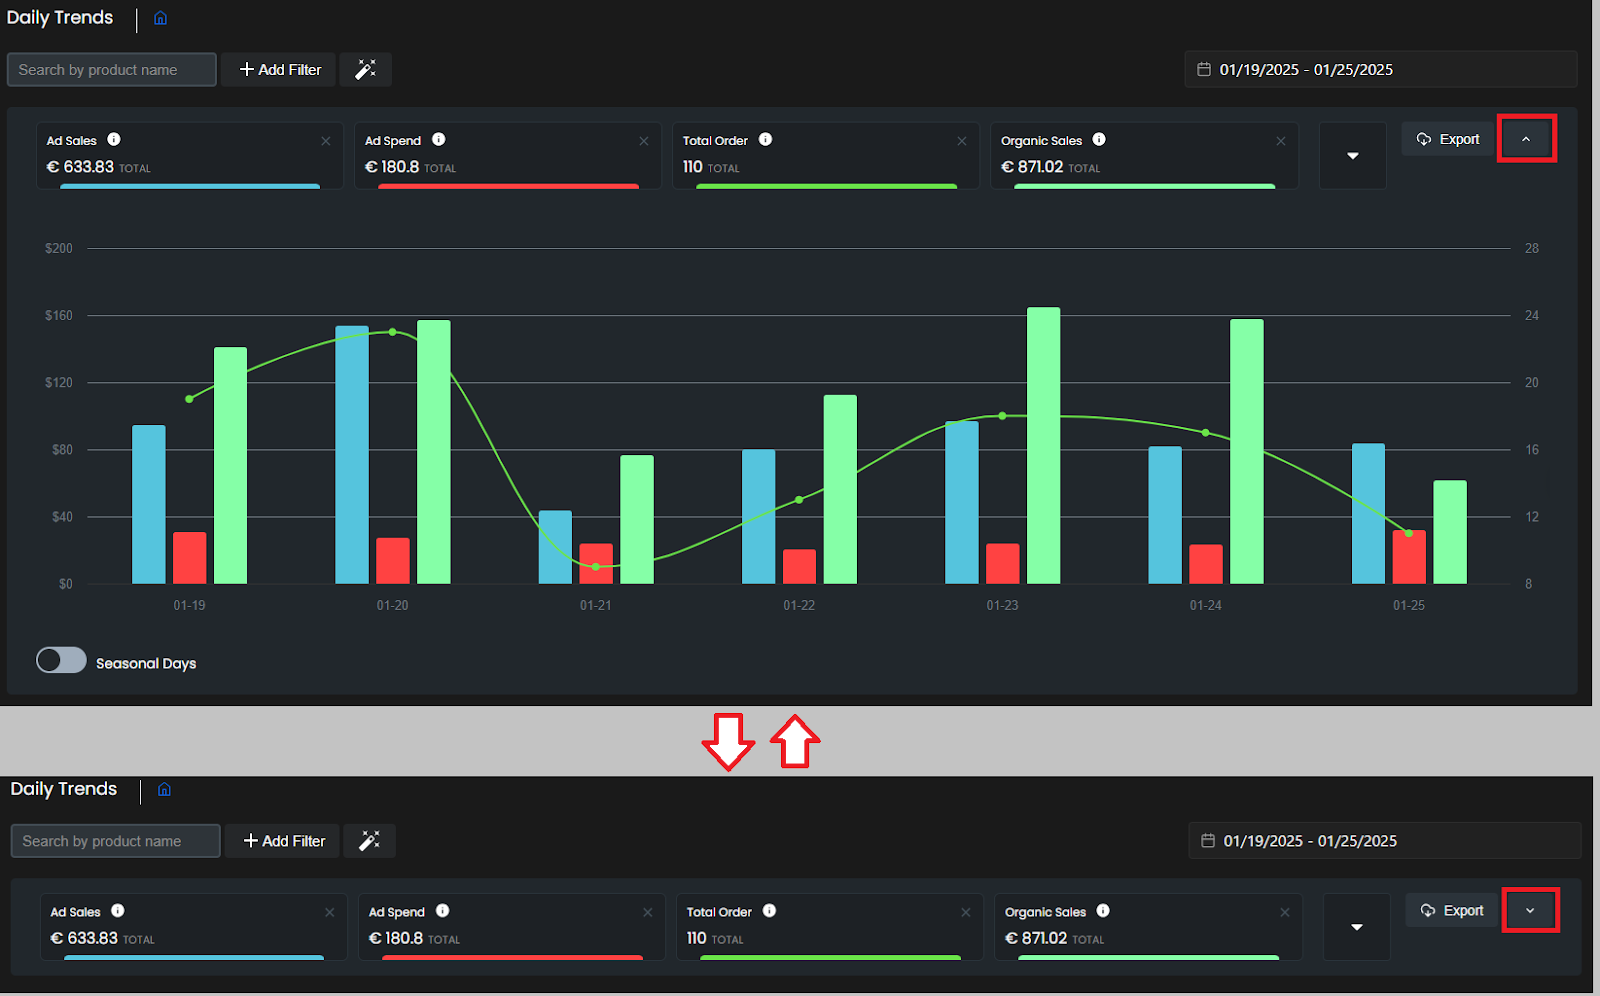
This section provides an interactive, real-time graphical representation of performance trends, helping sellers track changes and make data-driven decisions quickly.
Legend Cards: Instant Insights
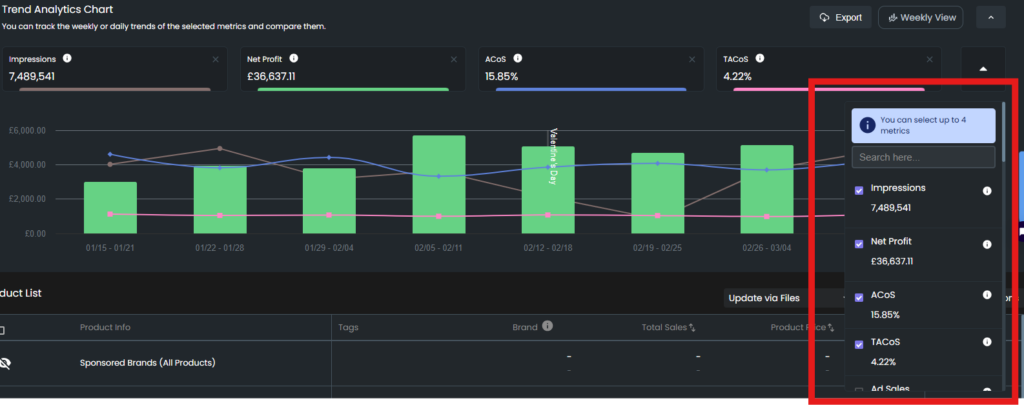
- Up to four key metrics can be displayed simultaneously, selected from a list of over 20 performance indicators.
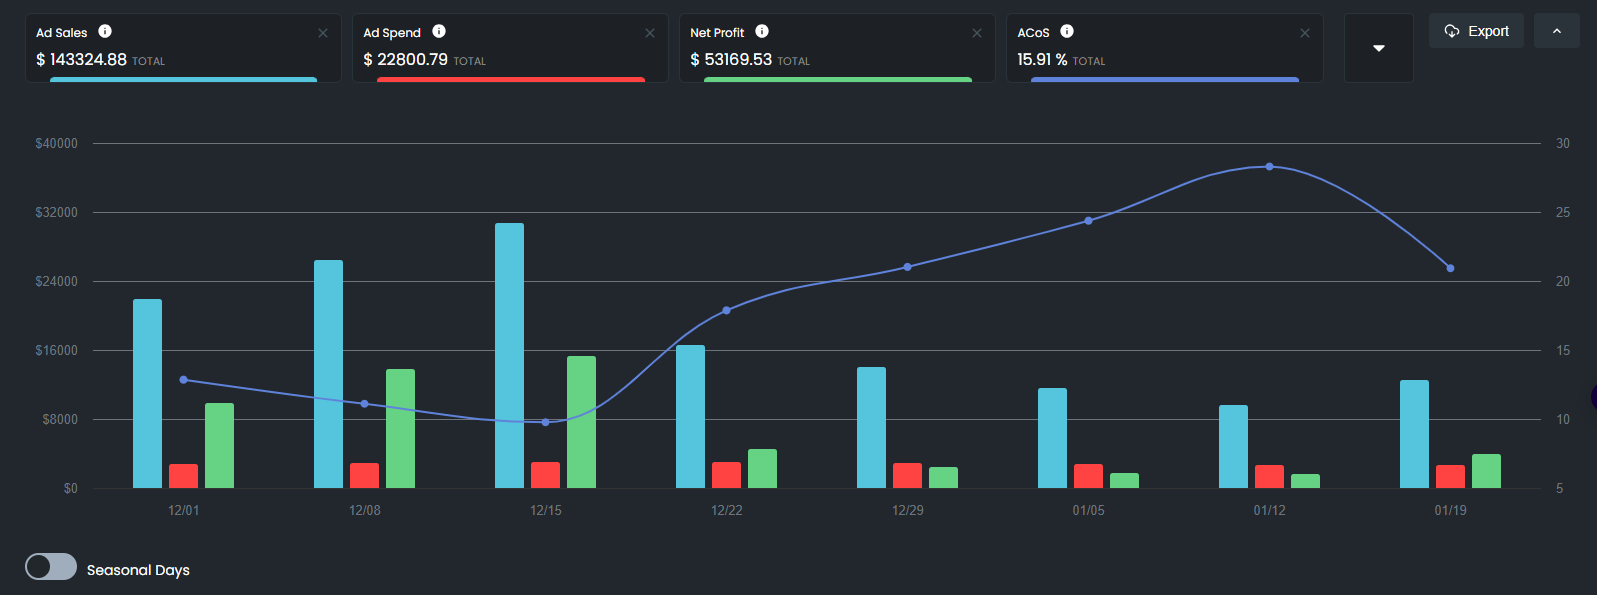
- Legend Cards above the chart display aggregated values, tooltips, and color coding for easy differentiation.
- Users can remove or replace metrics instantly, tailoring the chart to their needs.
Dynamic Chart: Track Trends Over Time
- The chart automatically adjusts based on the selected time frame.
- If data covers more than 56 days, the chart switches to a weekly view for easier interpretation.
- Users can compare advertising and organic performance metrics side-by-side.

Advertising Data & Seasonal Analysis
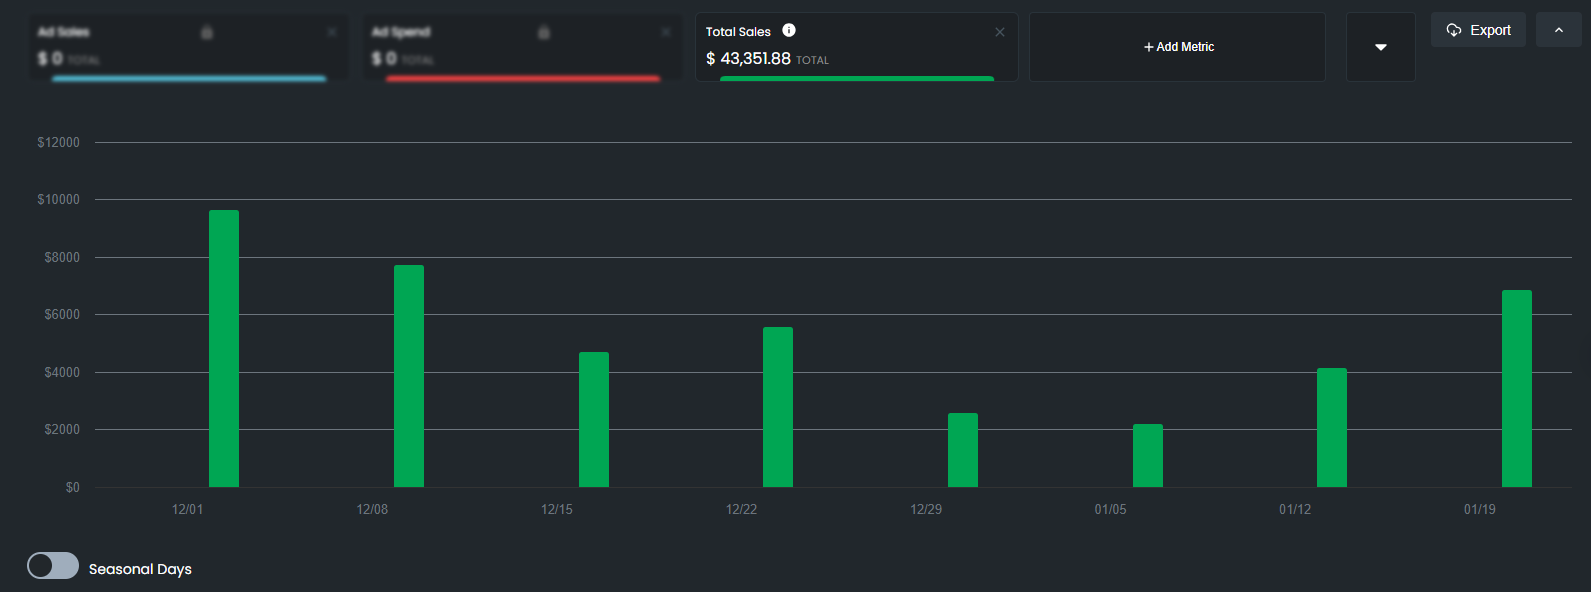
- Advertising-related metrics require a connected Amazon Ads account. If unavailable, these metrics will appear locked with a prompt to connect the account.
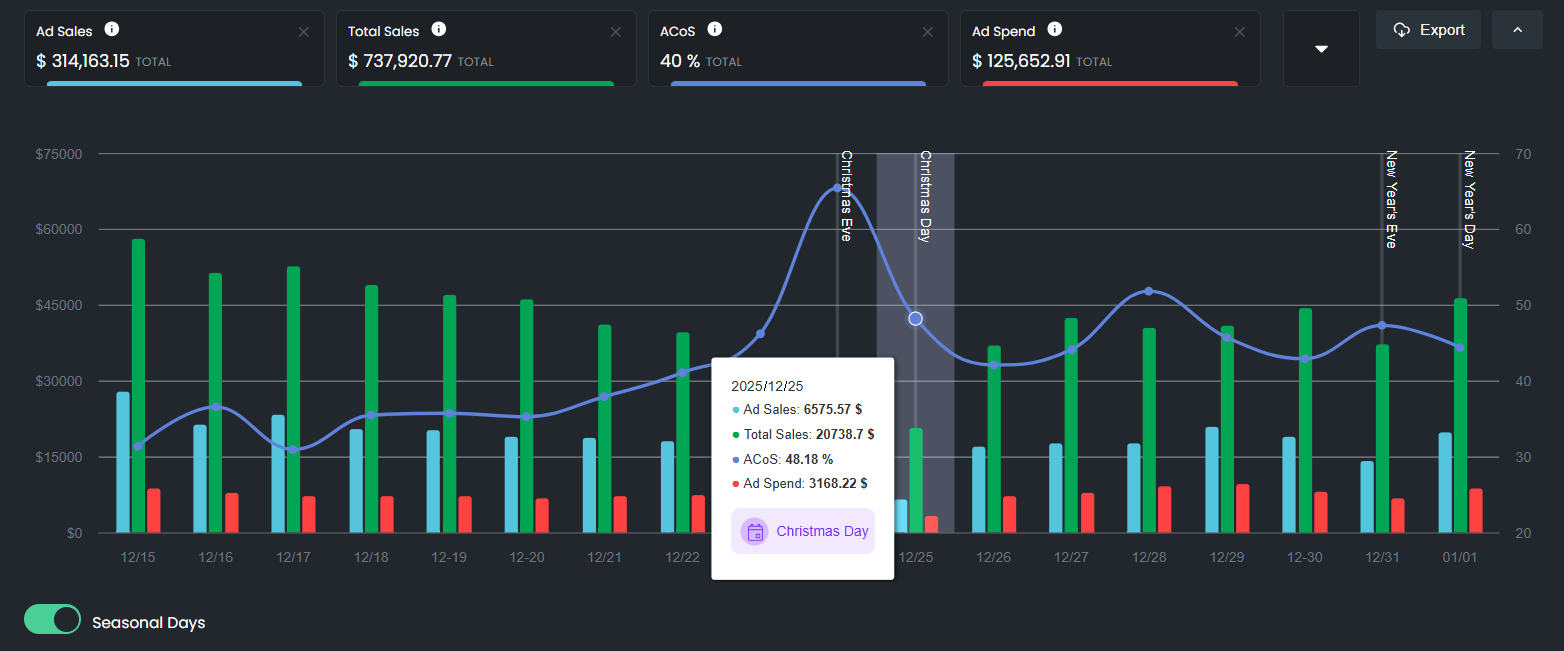
- The “Seasonal Days” toggle enables users to highlight major sales events (e.g., Prime Day, Black Friday) and analyze their impact on store performance.
Export & Expand Options
- Users can export chart data with a single click.
- The expand/collapse button allows for toggling between detailed views and a simplified summary mode.
Next up! Let’s learn about the Trend Analytics: Product List
“Ready to Elevate Your Success? Schedule a call with our experts today – simply click this link and choose a time that works best for you!”
Was This Article Helpful?
YesNo