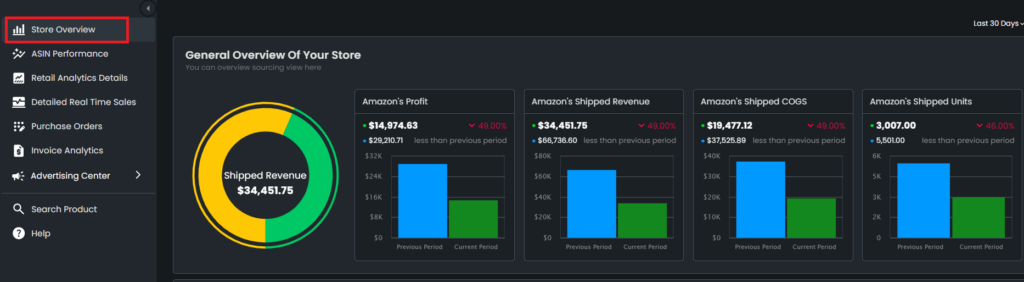
Store Overview for Vendor Accounts
As you log in to the platform, Store Overview is the page that first greets you. It contains a general overview of your vendor data. This page is similar in structure to the Store Overview page for the Amazon seller accounts.
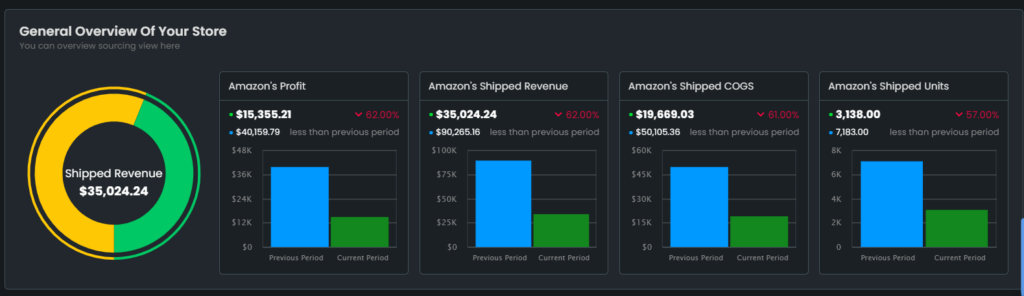
General Overview of Your Store section includes Amazon’s Profit, Amazon’s Shipped Revenue, Amazon’s Shipped COGS, and Amazon’s Shipped Units as seen in Figure 2.
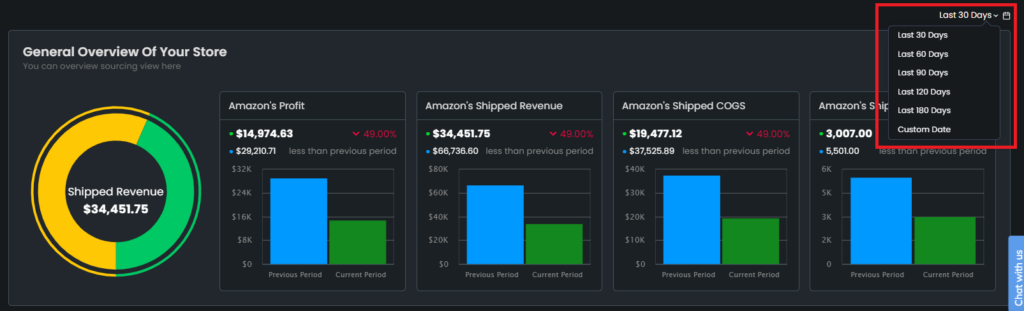
You can set select a time interval such as 30, 60, 90 days and so on or custom, for the data you wish to view from the dropdown menu on the upper right corner. Please see Figure 3.
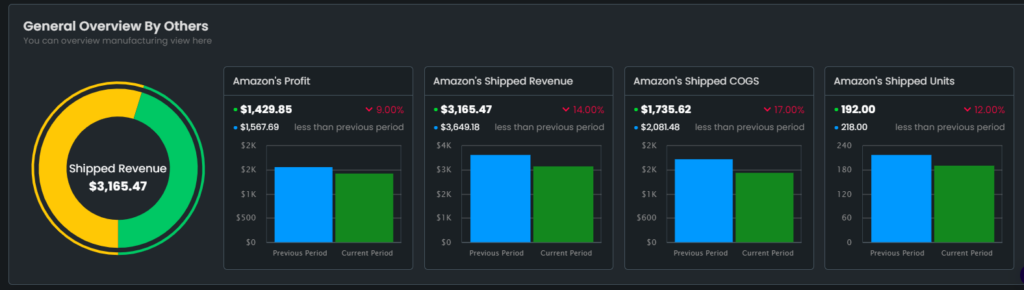
The charts below under General Overview By Others shows the same data for Amazon’s profit, revenue, COGS and units that was sold by other vendors. This way you can view what proportion of the sales you missed to others. See Figure 4.
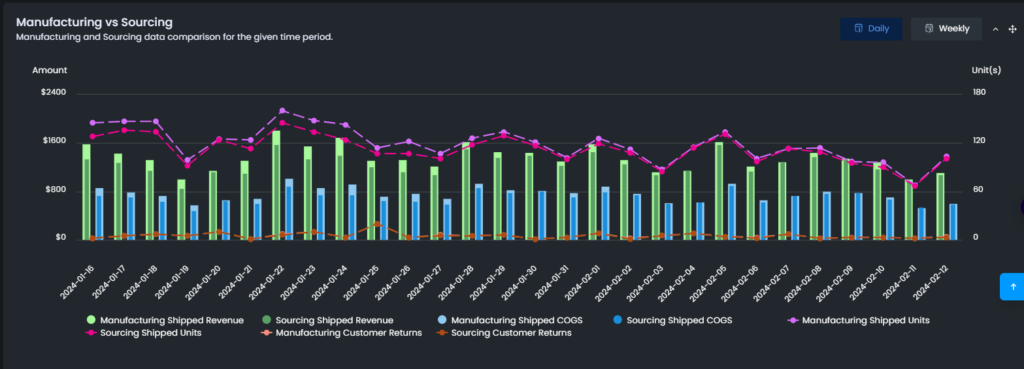
Manufacturing vs Sourcing chart below displays daily data of shipped revenue, COGS, units, and customer returns for the manufactured and sourced products. You can hover onto a specific day to view its data. Please see Figure 5.
“Ready to Elevate Your Success? Schedule a call with our experts today – simply click this link and choose a time that works best for you!”