Pricing Actions and Analytics: SKU Pricing and Buy Box Graph
Understanding how your product pricing impacts Buy Box ownership is crucial for success on Amazon. Eva’s SKU Pricing and Buy Box graph provides powerful, visual insights into your pricing strategy—helping you make smarter, data-driven decisions. Whether you’re a reseller or a private label seller, this tool lets you track your sales price, competitors’ prices, Buy Box trends, and key performance metrics over time.
Notes:
- This graph is only available if the SKU is pricig-enabled.
- For Resellers, the graph will show the last 24 hours. For Private Labels, it will be for the last 30 days.
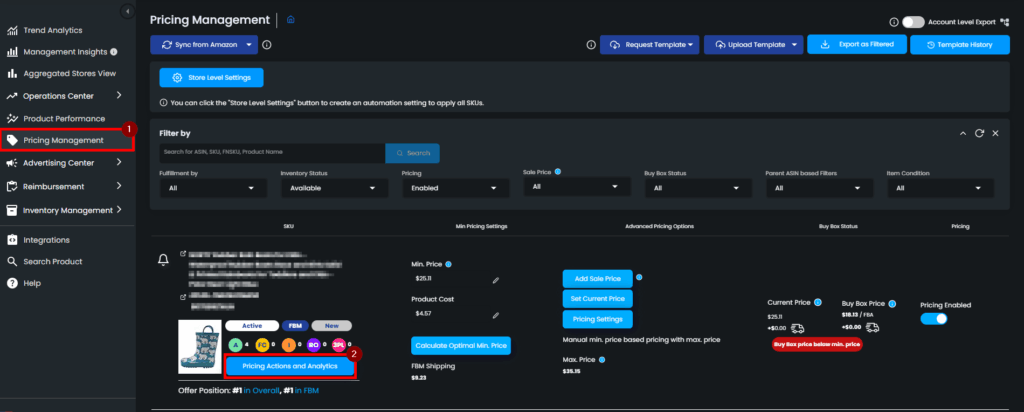
To access this page,
- Go to the Pricing Management section.
- Search for the SKU where you want to see this information.
- Click on Pricing Actions and Analytics.
- Inside the Pricing Actions and Analytics, you will see the graph below for SKU Pricing and Buy Box.
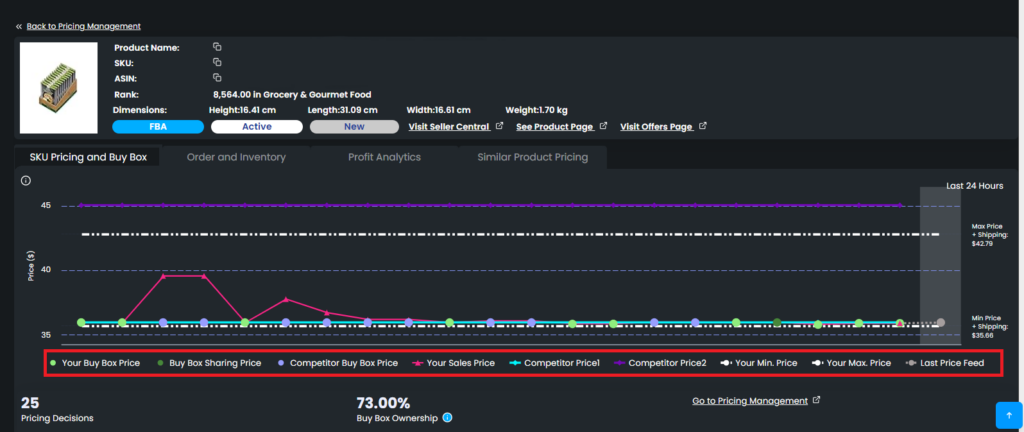
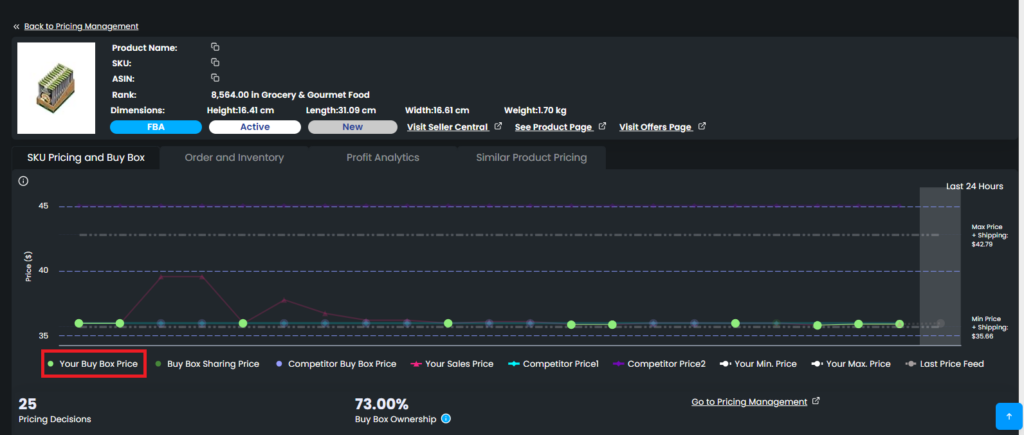
For Resellers, the chart displays relevant data for the SKU such as:
- Your Buy Box Price
- Competitor Buy Box Price
- Buy Box Sharing Price if the buy box is being shared,
- Your Sales Price
- Competitor Price 1
- Competitor Price 2
- Your Min. Price
- Your Max. Price
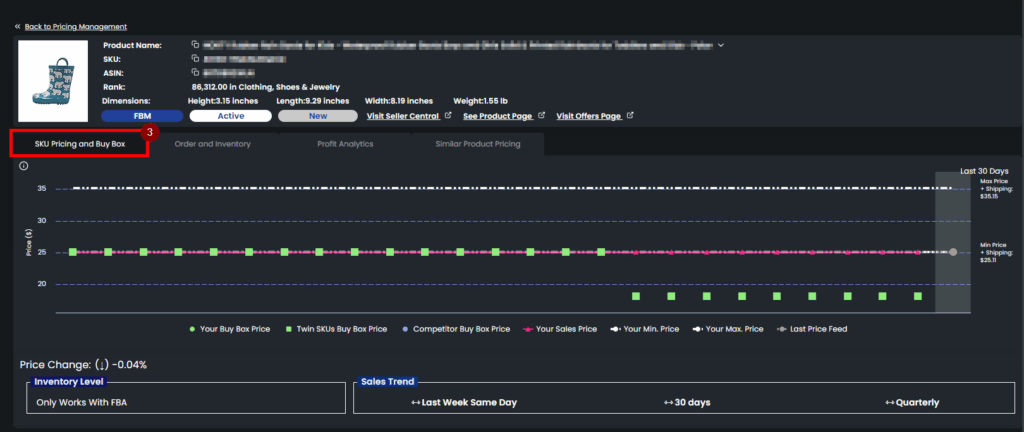
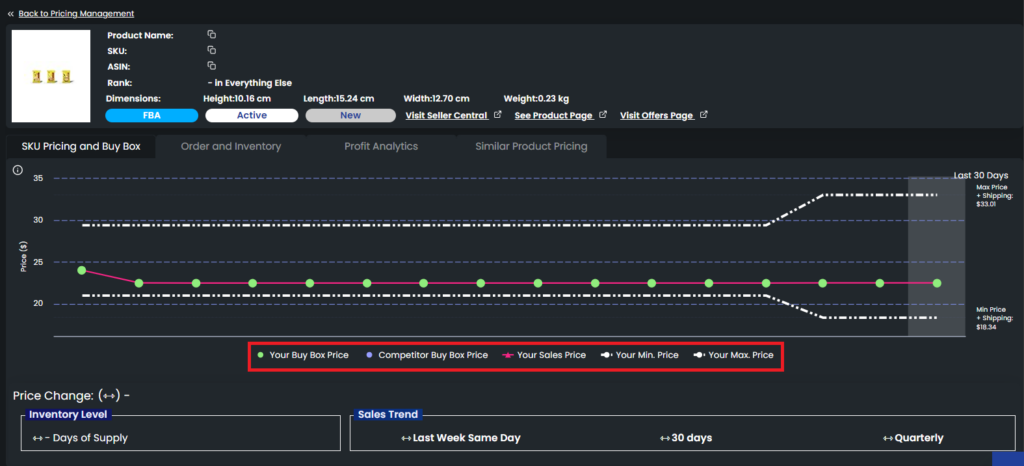
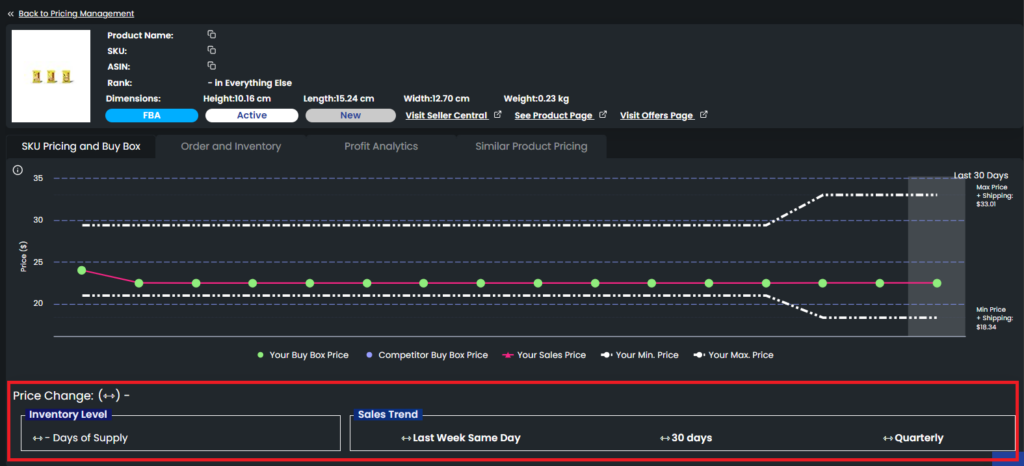
For Private Labels, the chart displays relevant data for the SKU such as:
- Your Buy Box Price
- Competitor Buy Box
- Your Sales Price
- Your Min. Price
Let’s dive deeper into this chart!
Each color represents a specific group on the chart, which is indicated with the colored icons next to the related group.
This is an interactive chart, which means that you can include or exclude any of these groups by simply clicking on each. Excluded groups are faded.
NOTE: If the competitor is above/below 50% of our product, Eva will act as a Single Offer.
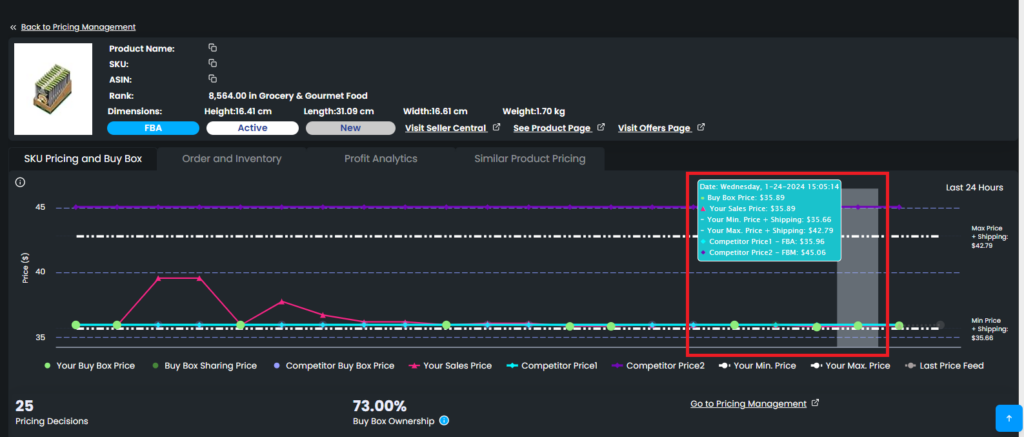
By hovering over a group, you can emphasize the related colored line on the chart.
When you hover over an icon on the chart, a pop-up text, showing the detailed numeric data and date, will appear.
If you use the “Similar Products Pricing” feature, on the SKU Pricing and Buy Box chart, a green star symbol represents the buy box ownership achieved with the competition max price.
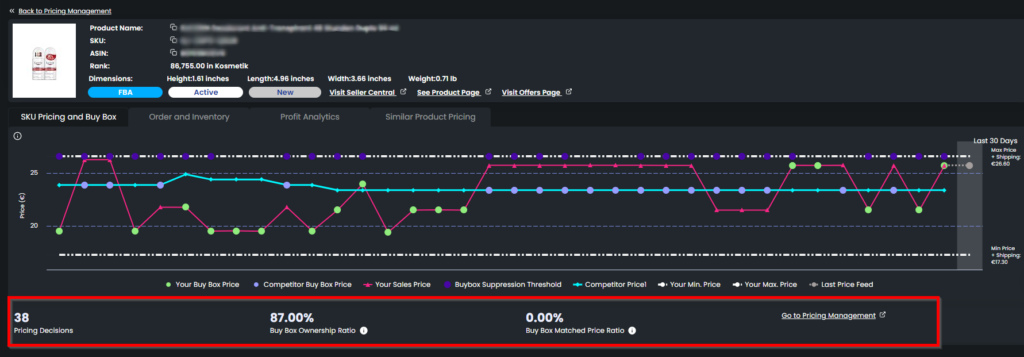
For the resellers, at the bottom, the total number of “Pricing Decisions“, and “Buy Box Ownership” as well as a link to “Go to Pricing Management” are displayed. We are presenting Buy Box information by categorizing the Buy Box Ratio data into two distinct categories one for holding Buy Box ownership and another for matching the Buy Box price without actually holding it.
For the private labels, “Price Change %” compared to the previous day, “Inventory Level” and “Sales Trend” including “Last Week Same Day“, “30 days” and “Quarterly” are displayed at the bottom for each day. In “Sales Trend”, “⬆️” symbolizes an increase in sales compared to the sales trend in the related time slot while “⬇️” symbolizes a decrease in the sales compared to the sales trend in the related time slot, while “⬅️➡️” symbolizes that price remained stable.
It is possible to see the explanation of the symbols on the chart by hovering over the info icon on the upper left side.
NOTE: If a product is out of stock, that means Amazon does not send any price change notification and Eva can not reprice the item. For Eva to reprice your product, make sure that it is in stock!
“Ready to Elevate Your Success? Schedule a call with our experts today – simply click this link and choose a time that works best for you!”