Pricing Actions and Analytics: Order and Inventory Analytics
It is possible to check the order and inventory status on the SKU level for up to 60 days.
To access the Order and Inventory Analytics,
- Go to the Pricing Management section.
- Search for the SKU where you want to see this feature.
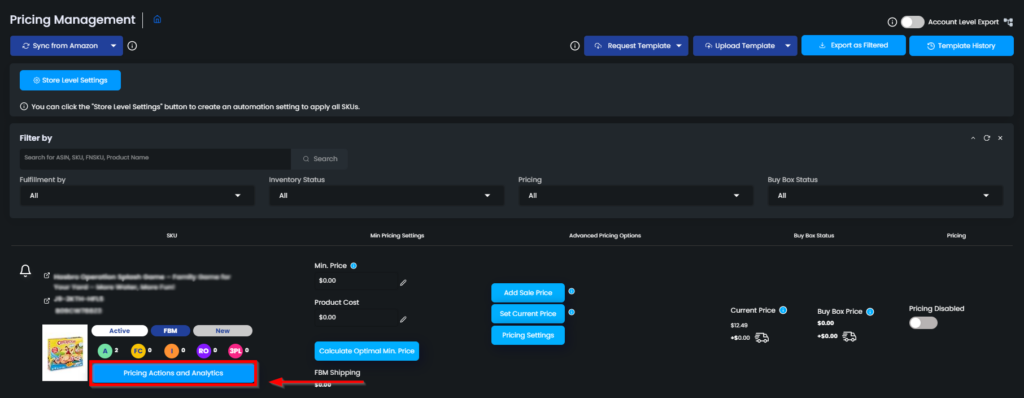
- Click on Pricing Actions and Analytics.
- Go to Order and Inventory.
To do so, go to the pricing management page and find the SKU of which order and inventory graph. Click on the “Pricing Actions and Analytics” button, and a pop-up screen will open. Please see Figure 1 below.
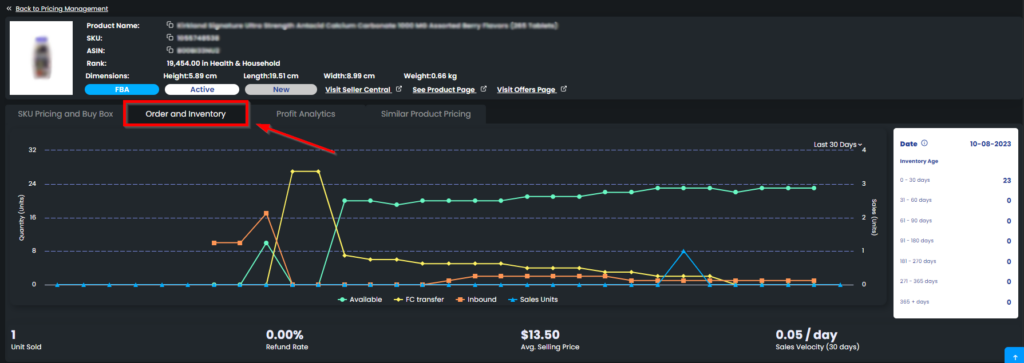
Understanding the Order and Inventory Chart
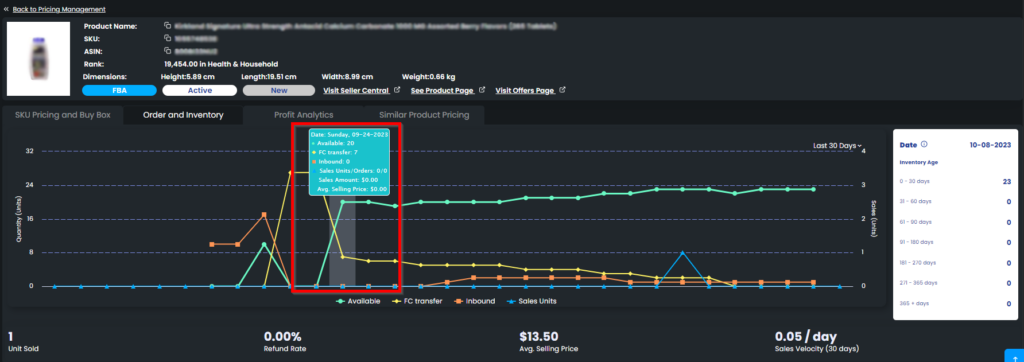
The related chart will be displayed with the data of “Available“, “FC Transfer“, “Inbound” inventory, and “Sales Unit“.
Each colored line represents a specific group on the chart, which is indicated by the colored icons next to the related group.
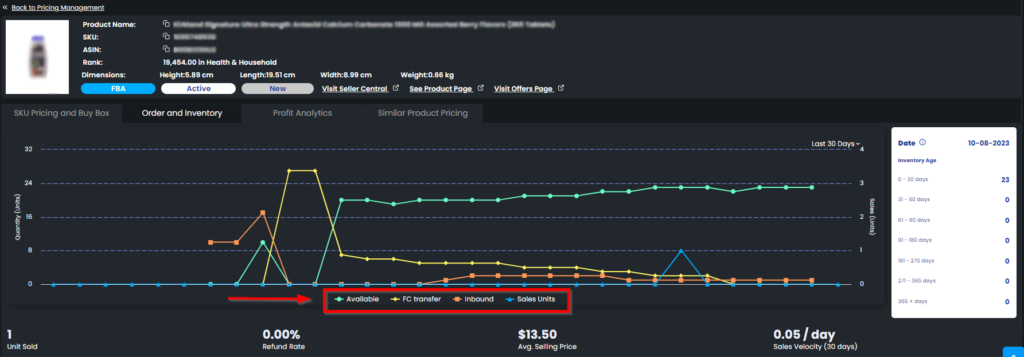
This is an interactive chart, which means that you can include or exclude any of these groups by simply clicking on each. Excluded groups are faded.
By hovering over a group, you can emphasize the related colored line on the chart.
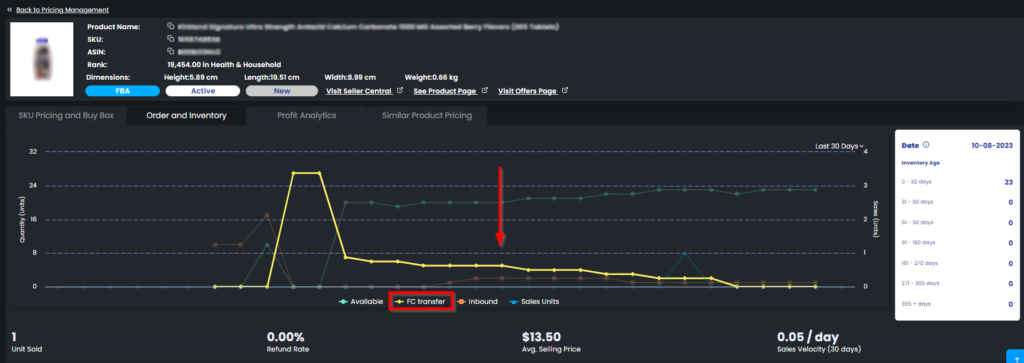
When you hover over an icon on the chart, a pop-up text, showing the detailed numeric data and date, will appear.
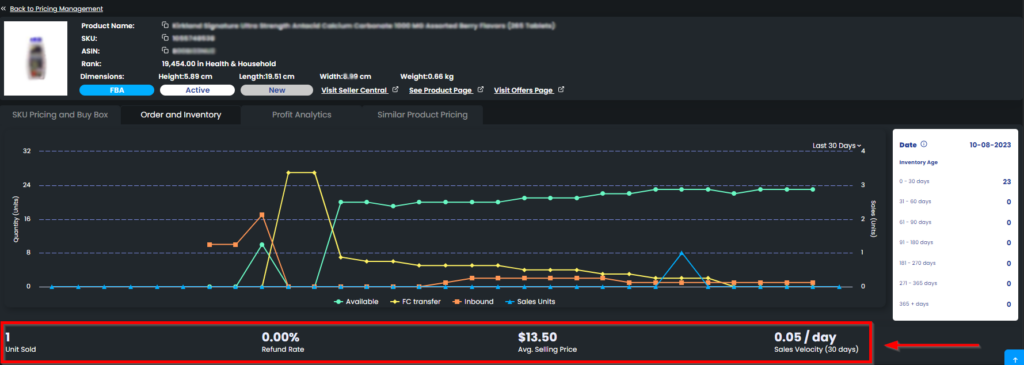
At the bottom, you can check the total “Unit Sold“, “Refund Rate” and “Average Selling Price” in the chosen time slot.
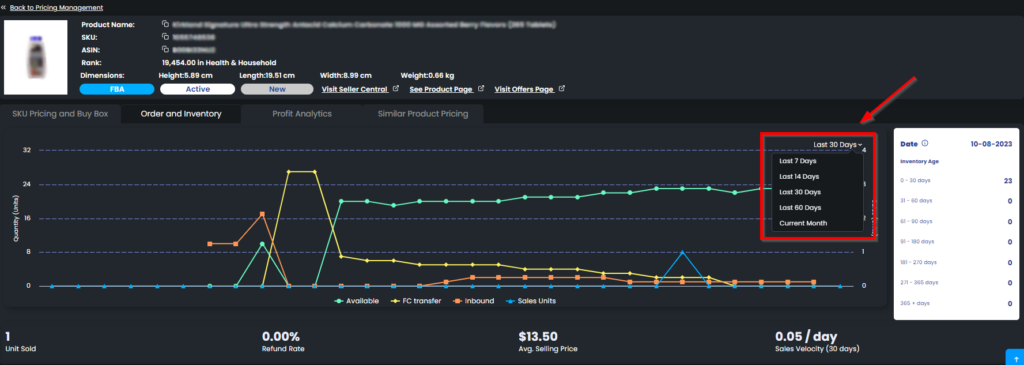
You can change the time slot by using the drop-down menu on the upper right side. Please see Figure 7 below.
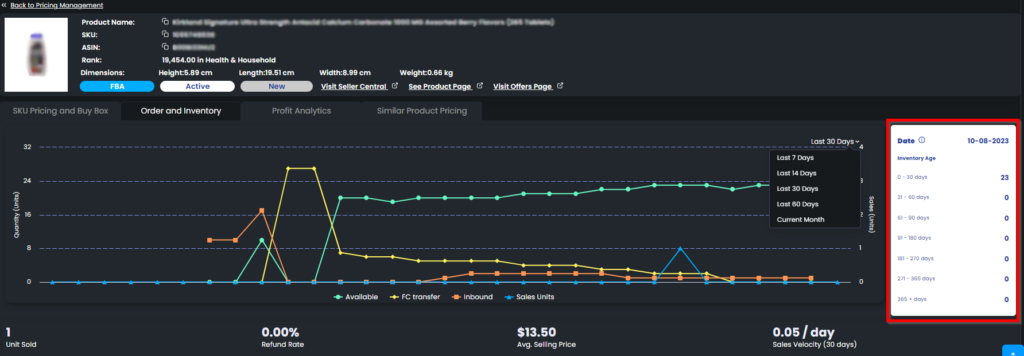
On the right side of the Order and Inventory chart, you can display the Inventory Age according to up-to-date information of the SKU selected.
“Ready to Elevate Your Success? Schedule a call with our experts today – simply click this link and choose a time that works best for you!”