Operations Center: ASIN Segmentation
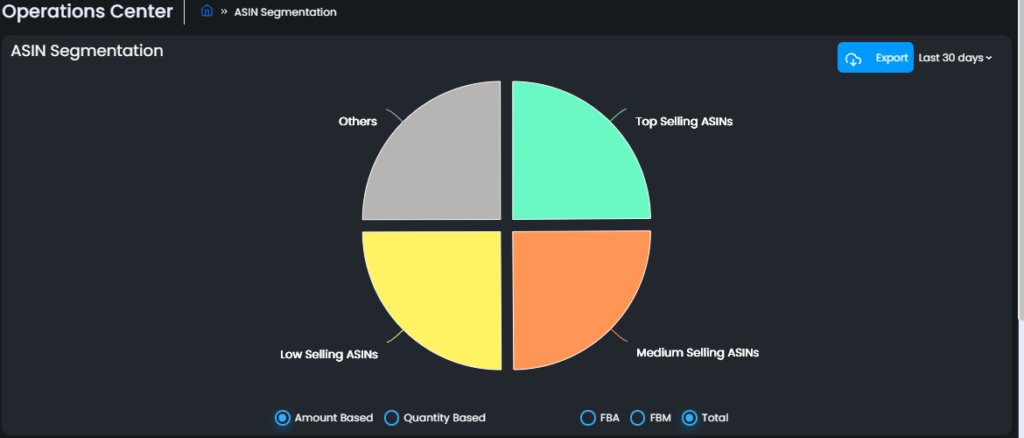
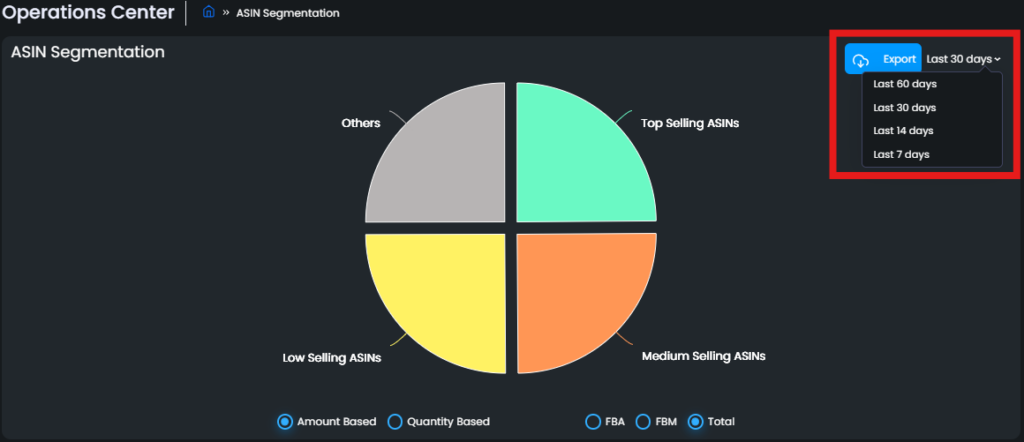
The ASIN Segmentation pie chart visualizes the sales distribution across all your ASINs, helping you assess their performance and make data-driven business decisions. This chart highlights which ASINs contribute most significantly to your revenue.
Eva categorizes your total sales into four segments: Top Selling ASINs, Medium Selling ASINs, Low Selling ASINs, and Others.
Segments:
Top Selling ASINs:
These ASINs are the ASINs that generated 20% of the revenue with an “x” amount of item which has the most sales.
Medium Selling ASINs:
These ASINs are the ASINs that generated 20% of the revenue with an “x” amount of item which has the second most sales.
Low Selling ASINs:
These ASINs are the ASINs that generated 20% of the revenue with an “x” amount of item which has the third most sales.
Others:
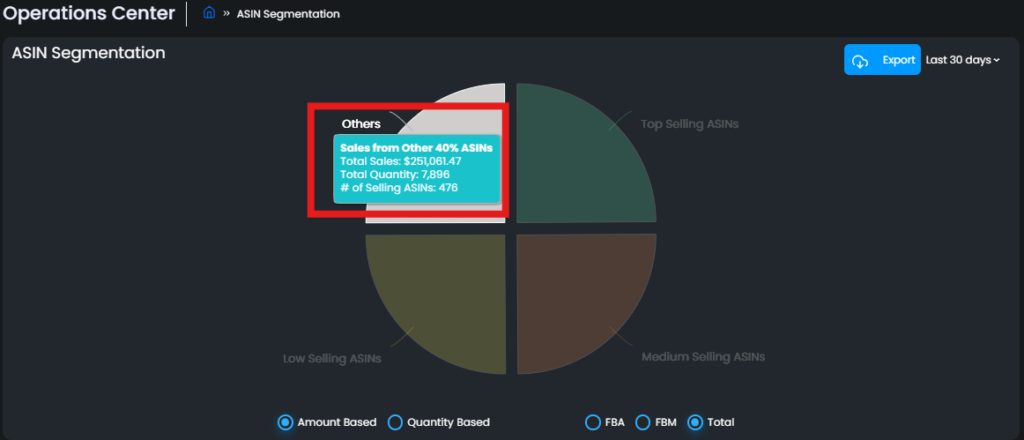
These ASINs are the ones that are not included in the previous three segments. 40% of your sales come from these ASINs.
When you hover over a slice of the chart, a pop-up appears displaying detailed sales information for the selected ASIN segment. This includes Total Sales, Total Quantity, and the number of selling ASINs (shown as # of Selling ASINs).
By default, Eva displays total revenue (Amount-based), but you can switch to view FBA or FBM sales separately or change the chart to a Quantity-based view.
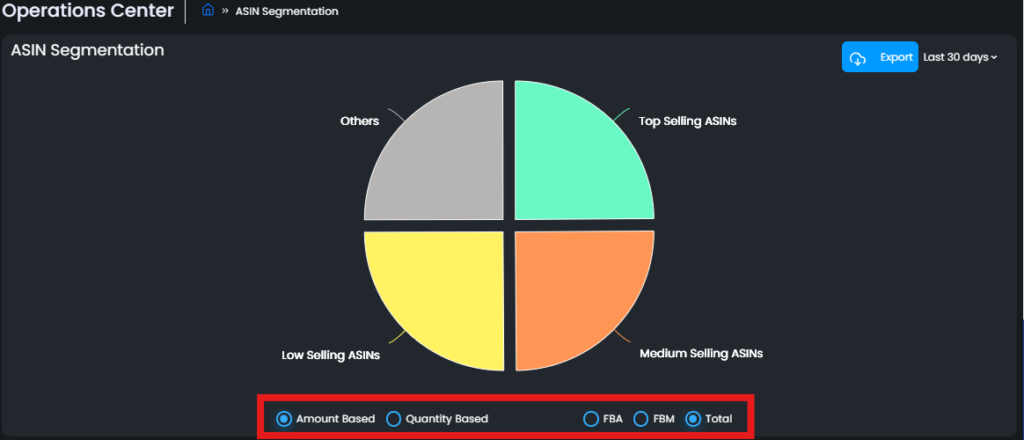
You can also export the data and adjust the time period to Last 7 days, Last 14 days, Last 30 days, or Last 60 days.
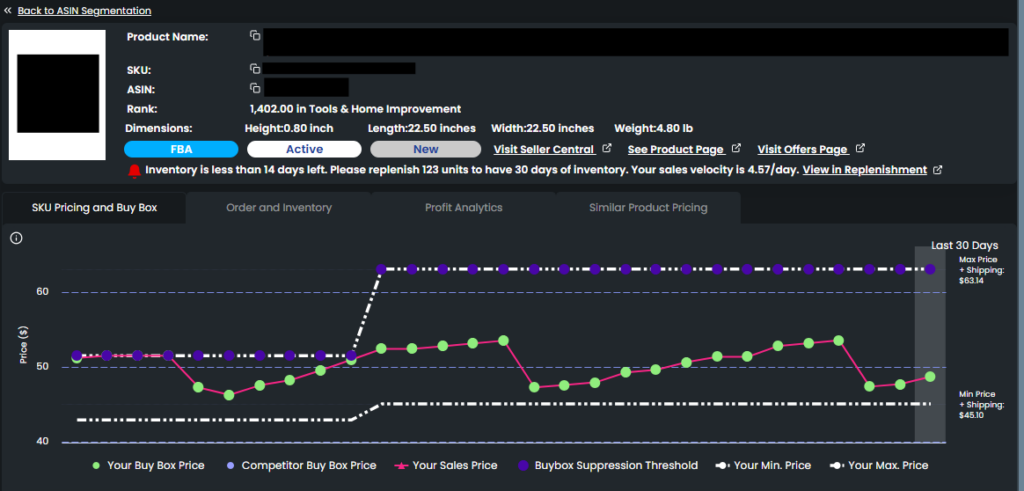
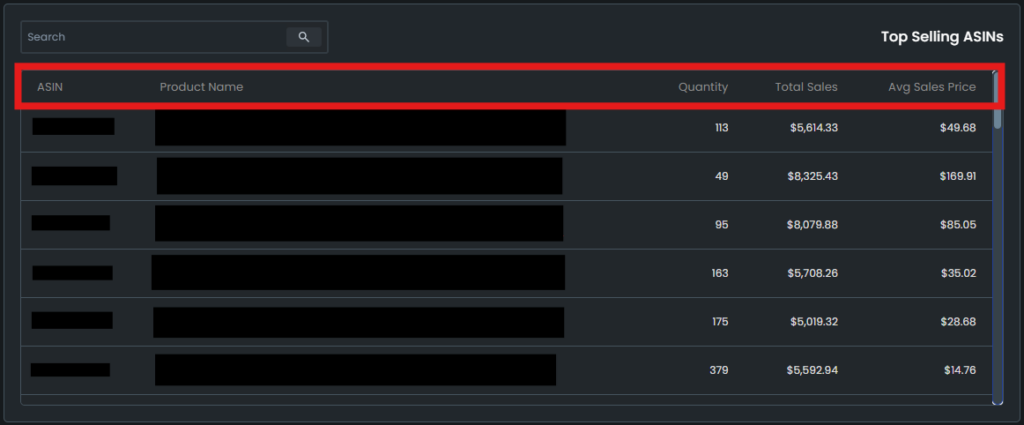
When you click on a slice of the pie chart, the related ASINs are displayed below with detailed information, including ASIN, Product Name, Quantity, Total Sales, and Average Sales Price.
If there are many ASINs, you can easily find a specific one using the search bar located in the upper left corner.
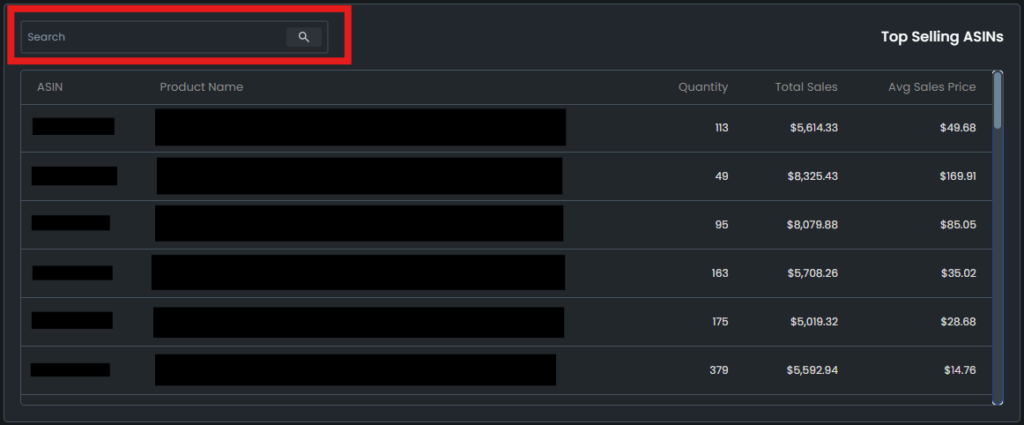
To view Pricing Actions and Analytics for a specific ASIN, simply click on the ASIN. The detailed analytics and pricing actions for the selected ASIN will then be displayed.