Warehouse Dashboard
The Warehouse Dashboard page provides an overview of your Warehouse’s data. Keep in mind that this page is visible to user that are Warehouse Admins and Super Admins.
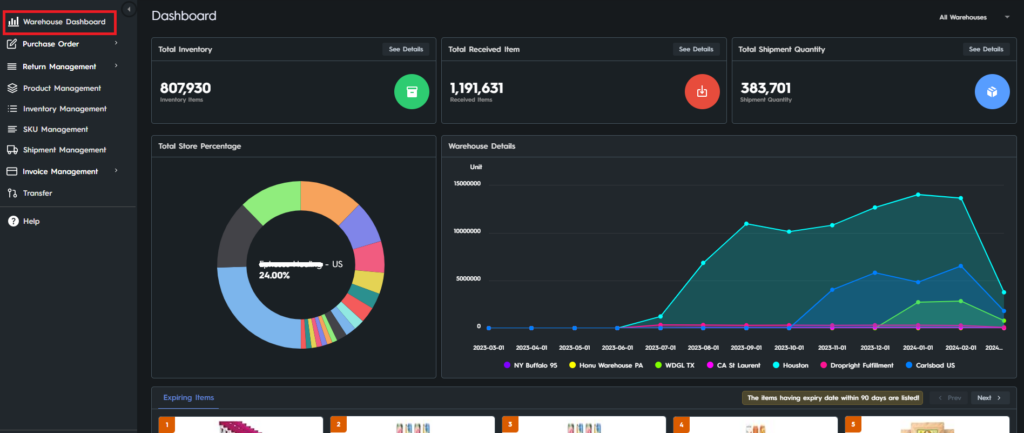
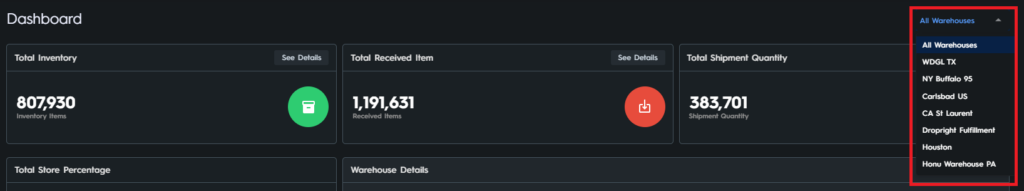
Total Inventory, Total Received Item, and Total Shipment Quantity boxes show the amounts of each category in your warehouse.
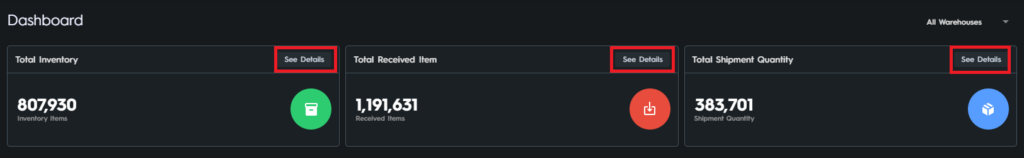
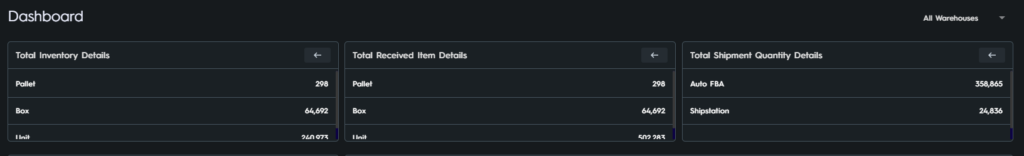
You can click See Details on the upper right corner of the chart (See Figure 2) to see a breakdown of the data in pallets, boxes, and units for Total Inventory Details and Total Received Item Details, and see the Auto FBA and Shipstation amounts for Total Shipment Quantity table.
You can choose the warehouse you want to see the data of by using the dropdown menu on the upper right corner of the screen, please see Figure 4.
Below the page two there are two charts: Total Store Percentage and Warehouse Details.
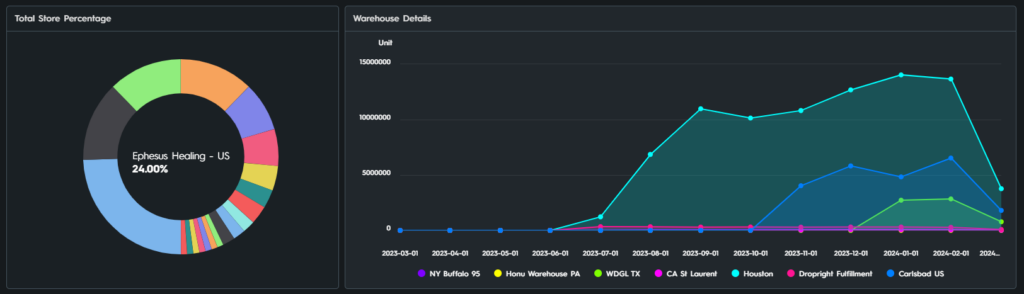
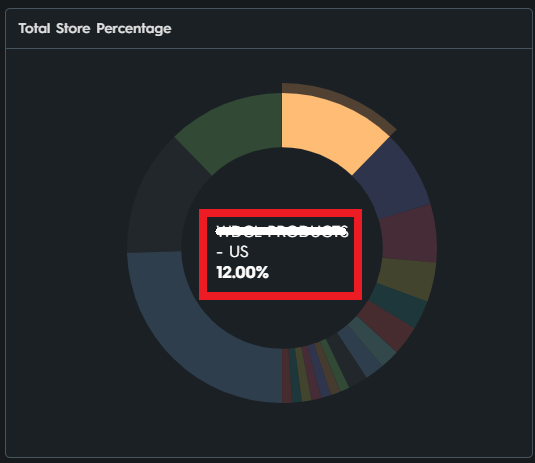
Total Store Percentage is a donut chart that displays the percentage of stores that take the space in the selected warehouse. You can hover over any store on the chart to see its percentage, please see Figure 6.
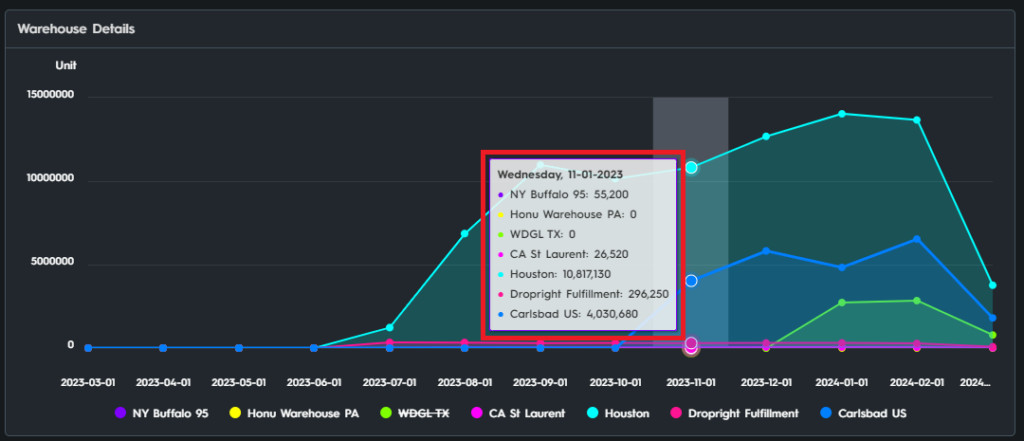
The Warehouse Details Chart displays monthly unit data. You can hover over any month to see its breakdown.
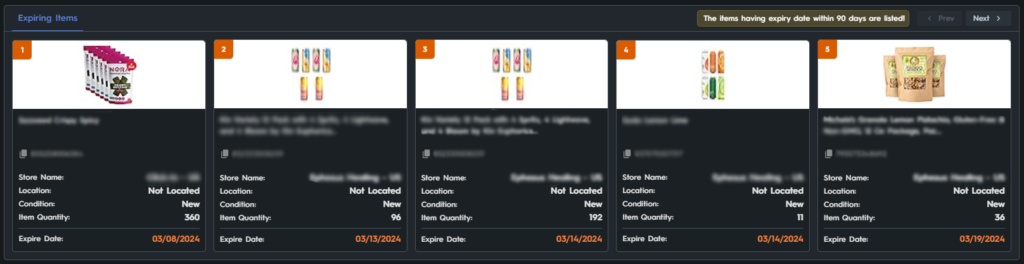
Your items that are within 90 days of their expiration date are listed on the Expiring Items table, so that you don’t get caught off guard by expired items and can take action beforehand. Please see Figure 8.