Total Expense Chart
Total Expense Chart displays your expense data and gives a deeper insight into these outgoes in a chosen month or last 30 days.
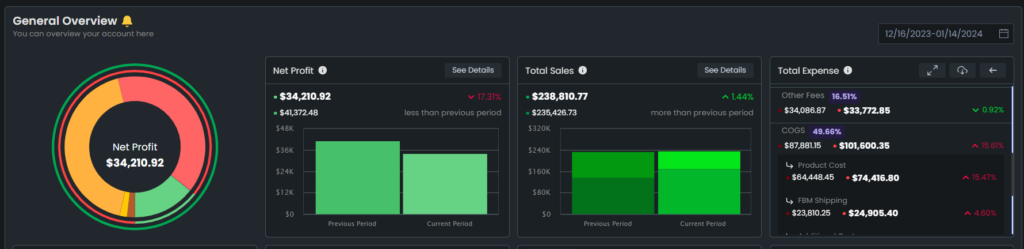
These outgoes are plotted in the General Overview, look for the chart of the Total Expenses and press “See Details” and their amount is going to be listed below. On this chart your COGS, advertising costs, business expenses, refunds, and all fees are displayed. You can scroll down or up with the cursor to go below the list. Please see Figure 1 below.
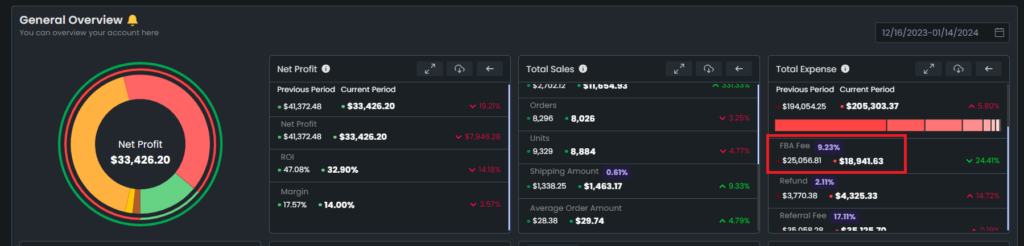
If you want to check a specific outgo on this list, for example the FBA fee expense, you can see it listed under the Total Expense. Please see Figure 2 below.
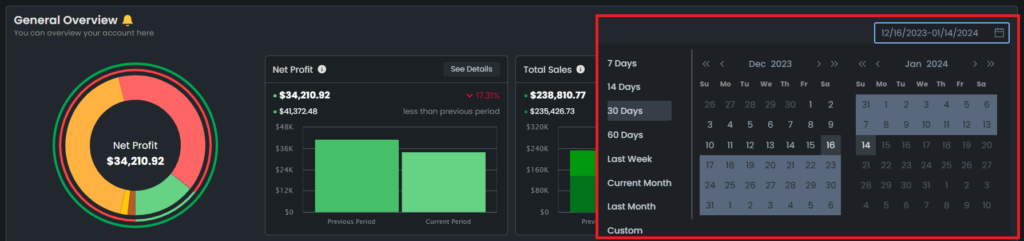
It is possible to change the time range from the drop-down menu on the upper right side. To do so, go and hover over the time range, and a dropdown menu will appear, from which you can choose the time range. Please see Figure 3 below.
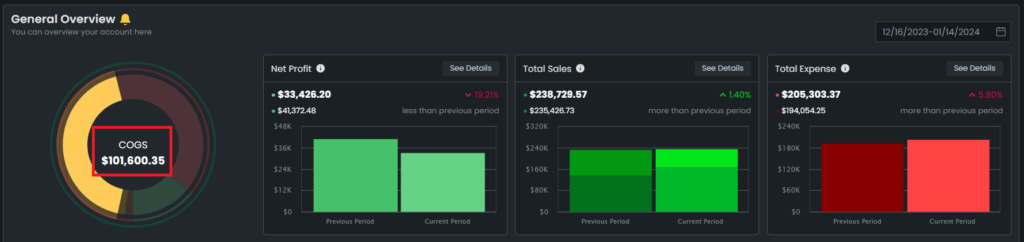
There is a color guide for the chart, each color represents a specific outgo, which you can see next to the name of the outgoes. On the pie chart, you can go and hover over a specific color and in the center is going to show you the title and amount. In the center the text is going to show what this part of the chart stands for, and also the amount of the represented outgo. Please see Figure 4 below.
Most of the data on this chart is updated when Amazon provides a Settlement Report. Only COGS data is updated every day.