Management Insights: Advertising Table
Note: This is only applicable if you connect your Advertising account to Eva.
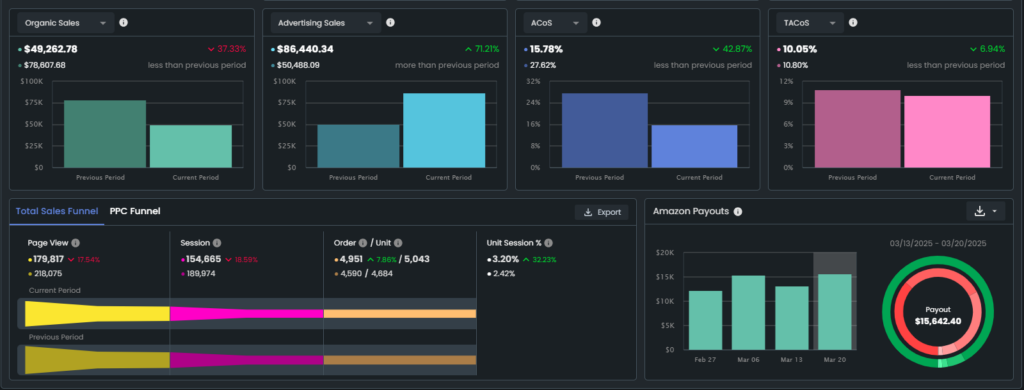
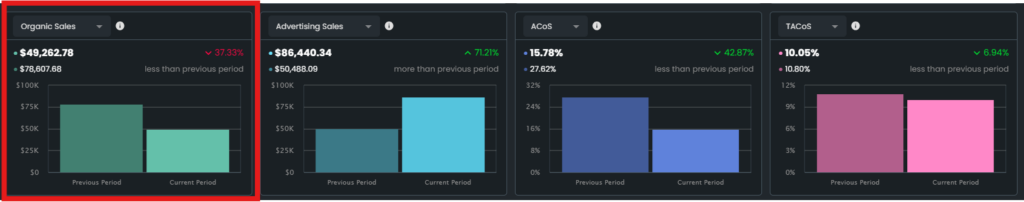
The Advertising Table provides a clear summary of your key performance metrics. It compares your current period’s performance with the previous period (depending on the selected period at the top part of the page), displaying percentage changes for a more straightforward analysis.
Let’s dig deeper into each chart!
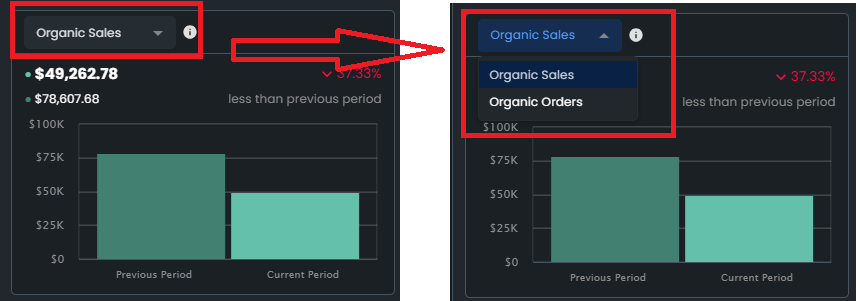
Organic Sales/Organic Orders
- The Organic Sales chart shows the sales amount of the store in a selected period without direct advertising efforts.
- The Organic Orders chart shows the number of orders from the store in a selected period without direct advertising efforts.
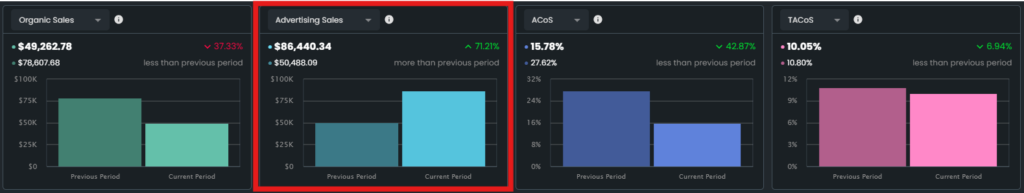
Advertising Sales/Advertising Orders
- The Advertising Sales chart shows the total sales amount of the store in a selected period impacted by advertising.
- The Advertising Orders chart shows the total amount of orders from the store in a selected period impacted by advertising.

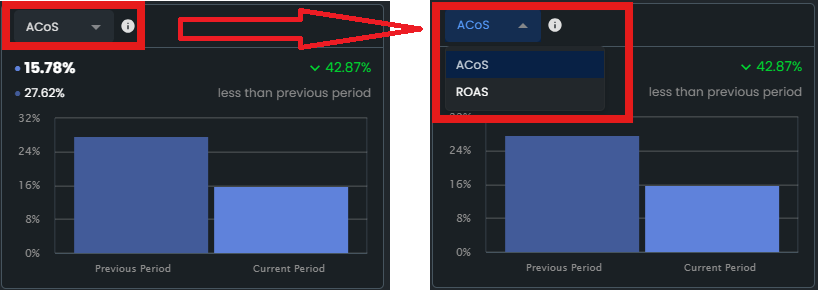
ACoS/RoAS
- The ACoS (Advertising Cost of Sales) chart shows the ad-driven revenue in a selected period.
- The RoAS (Return on Ad Spend) chart shows the revenue generated for every dollar spent on ads in a selected period.
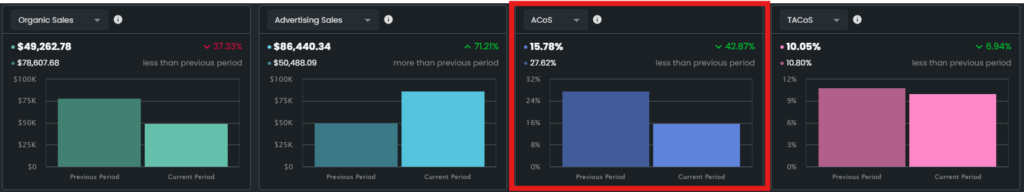
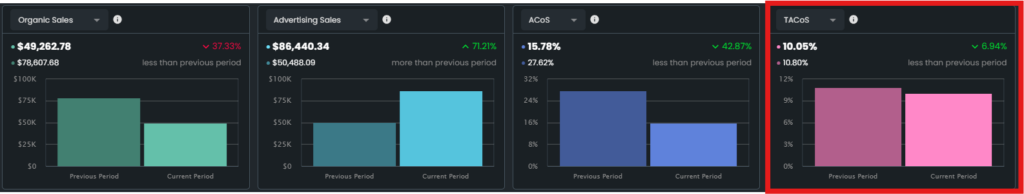
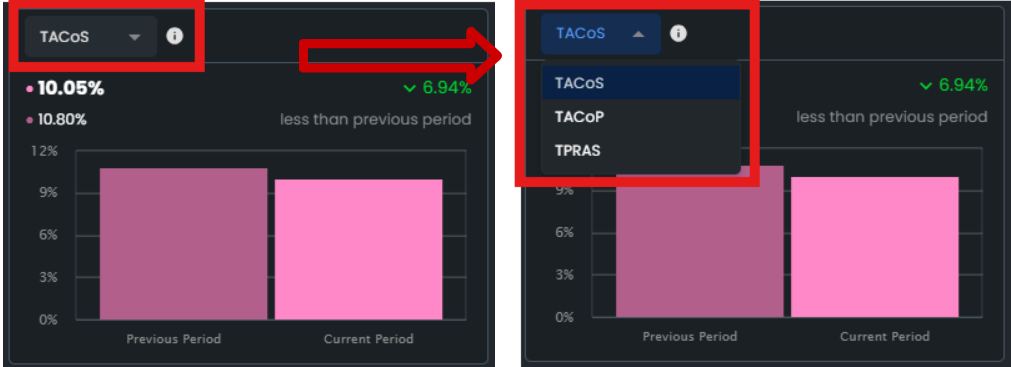
TACoS/TACoP/TPRAS
- The TACoS (Total Advertising Cost of Sales) chart shows the ratio of total advertising spend to total revenue (both organic and paid).
- The TACoP (Total Advertising Cost of Profit) chart shows how much your advertising spend contributes to your overall profitability, giving you a clearer picture of your ad investment efficiency.
- The TPRAS (Total Profit Return on Ad Spend) chart shows the profitability of advertising by considering both total revenue and costs.
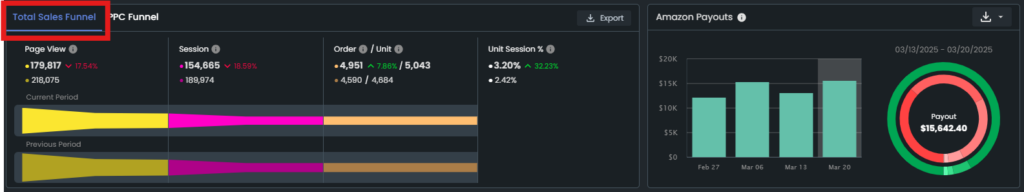
Total Sales Funnel
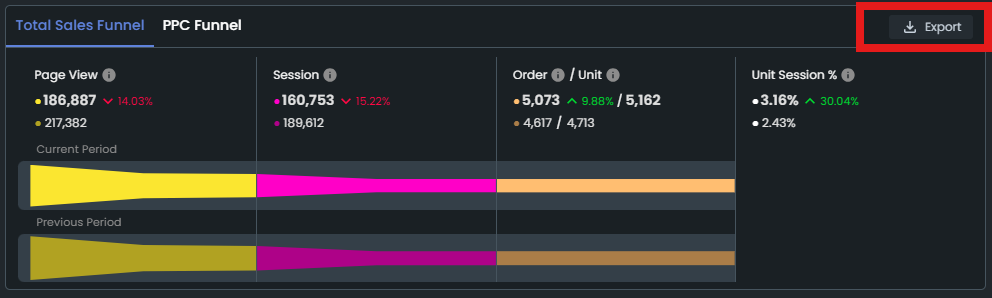
The Total Sales Funnel provides a clear view of your customer’s journey—from discovering a product (page views) and engaging with it (sessions) to making a purchase (order units).
Additionally, you can track USP (Unit Session Percentage), which measures the average number of product units sold per session. This valuable metric helps you assess how effectively each session is converting into sales, enabling you to optimize your strategies for better performance.
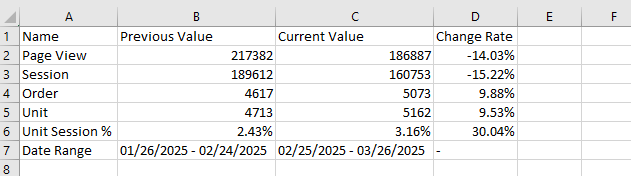
You can export the data by clicking on the “Export” button.
The exported file will contain the Name of Data, Previous Value, Current Value, and Change Rate.
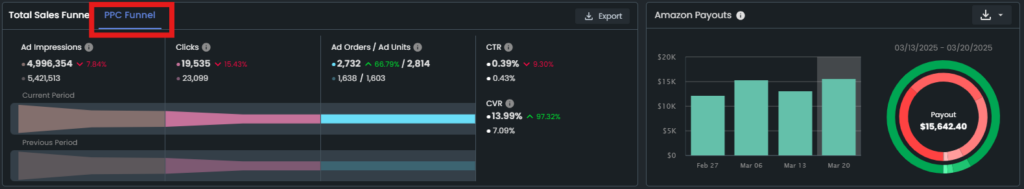
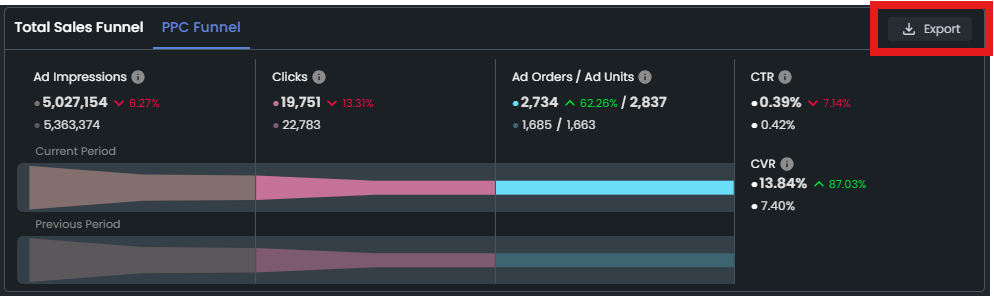
PPC Funnel
The PPC (Pay-Per-Click) Funnel shows an in-depth visual analysis of your advertising performance at every stage—from impressions to clicks to conversions. You can easily identify where potential buyers drop off and optimize your ads for better results.
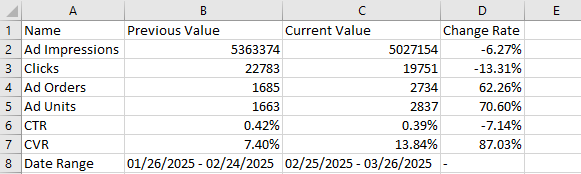
You can export the data by clicking on the “Export” button.
The exported file will contain the Name of Data, Previous Value, Current Value, and Change Rate.
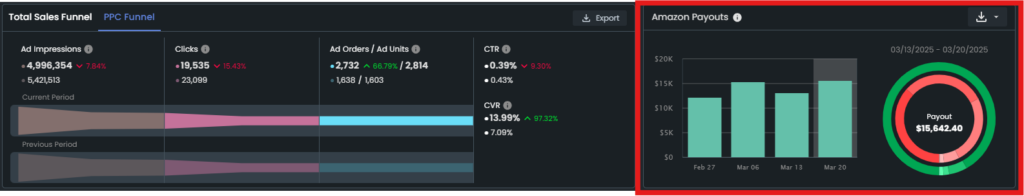
Amazon Payouts
The Amazon Payouts section shows a summary of your Amazon payment information, including:
- Your current total balance
- Available funds
- Recent payouts across various account types for each settlement within the selected period
You can export ‘Payout Analytics’ in Microsoft Excel by clicking the “Export” button. The analytics can be exported as MS Excel or Google Sheets.
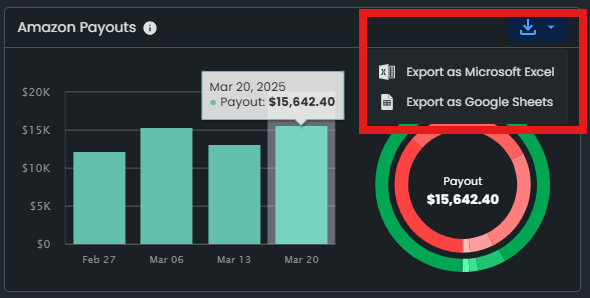
The exported file will show under Operations Center > Reports. Download the file and Enable Editing to edit any information.
The file contains two tabs: ‘Analytics’ and ‘Source Data.’
Source Data Tab:
Detailed information for each settlement transaction date is provided, including transaction type, order ID, fee details, and product cost for sold items, facilitating profit calculation for each transaction.
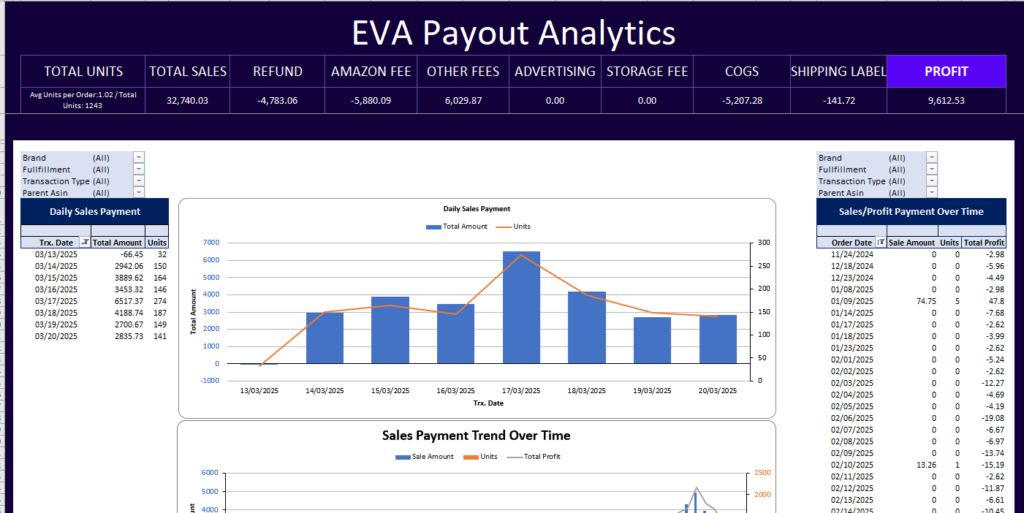
Analytics Tab:
This tab offers summarized data through filterable pivot tables, such as ‘Daily Sales Payment’ and ‘Sales Payment Trend Over Time.’ The former displays payout amounts and units sold for each transaction date, while the latter shows sale amounts, units sold, and profit for each order date. Both tables are complemented by combo charts for visual representation. Moreover, you can identify the most profitable products within a selected settlement period with the ‘Top 10 Profitable Products’ chart.
With these interactive graphs, detailed comparisons, and real-time updates, you can quickly identify performance trends and maximize your ROI. Stay ahead by focusing on what’s working and fine-tuning areas that need improvement!
“Ready to Elevate Your Success? Schedule a call with our experts today – simply click this link and choose a time that works best for you!”