How to Use Replenishment Page
Every FBA seller is aware that adjusting inventory when it comes to Amazon standards might be challenging, and your business needs to keep it balanced to get success. It may be hard to take care of every single inventory by yourself, but the silver lining is you do not have to!
EVA has a very comprehensive Replenishment feature that covers all of the inventory for you. You can monitor how many items you need to replenish to Amazon and when to replenish them from that screen.
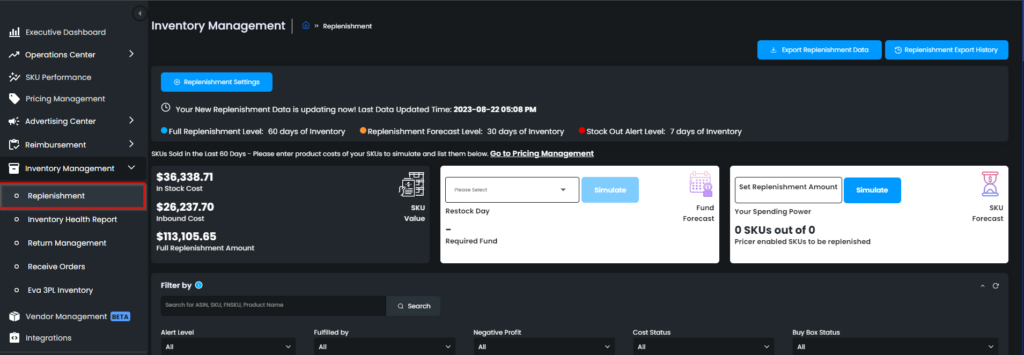
Once you click on Inventory Management, the Replenishment Page option will appear. See Figure 1 below.
On top of the screen, you can see three markers that identify your settings. When you first enter the replenishment page, those numbers you see below will come as default. Please see Figure 2 below.
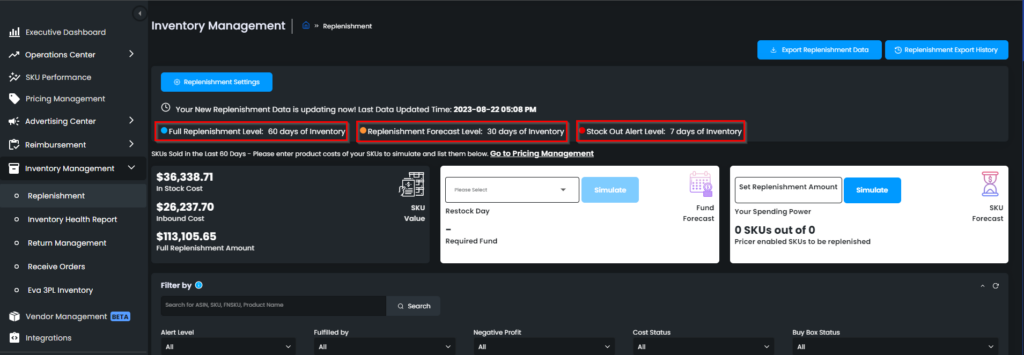
Let’s examine the process based on the numbers above. The replenishment system calculates your sales for 30 days for each SKU and starts to monitor your inventory based on this sales amount. It is expected that there will be approximately the same amount of sales every 30 days and stocks should be enough to compensate. This time range is referred to as the “Full Replenishment Level.”
“Replenishment Forecast Level” means; that if your inventory goes below the number which equals 21 days of optimal sales, then the replenishment system starts to warn you to complete your replenishments to cover 30 days of inventory.
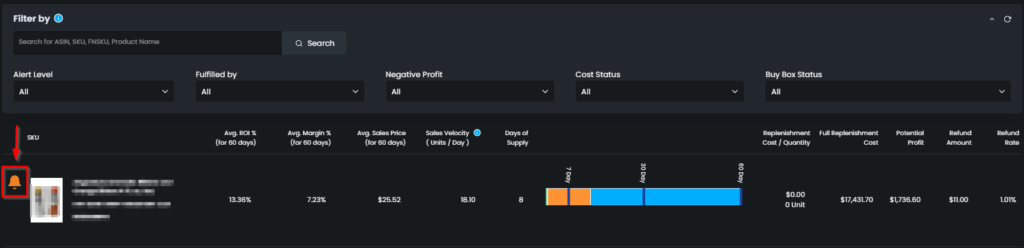
You can also see this warning next to your SKUs on the Pricing Management page with the orange bell icon.
“Stock-Out Alert Level” means; that if your inventory goes below the number that equals 7 days of optimal sales, then the replenishment system begins to alert immediately.
You can also see this warning next to your SKUs on the Pricing Management page with the orange bell icon. Please see Figure 3 below.
Replenishment Settings
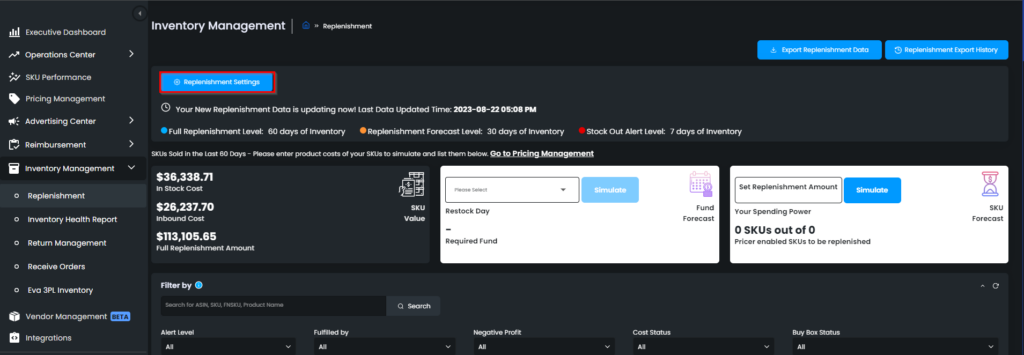
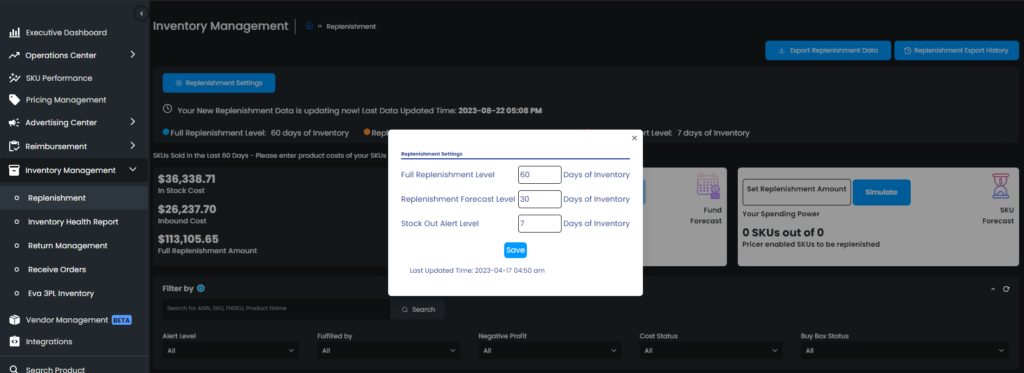
You can customize your period settings by clicking on the “Replenishment Settings” button on the upper left side of the page. Please see Figure 4 below. Once you click on the button, a pop-up screen will appear. You can customize all the intervals mentioned below on this screen. Enter the number of the days in the related field and click on “Save“. The changes will be applied directly. Please see Figure 5 below.
Below the Replenishment Settings will be three cards; SKU Value, Fund Forecast, and SKU Forecast. In the SKU Value card, you can see cost values belonging to all of your in-stock SKUs, and inbound cost values, and the amount that covers a potential Full Replenishment.
SKU Value Card
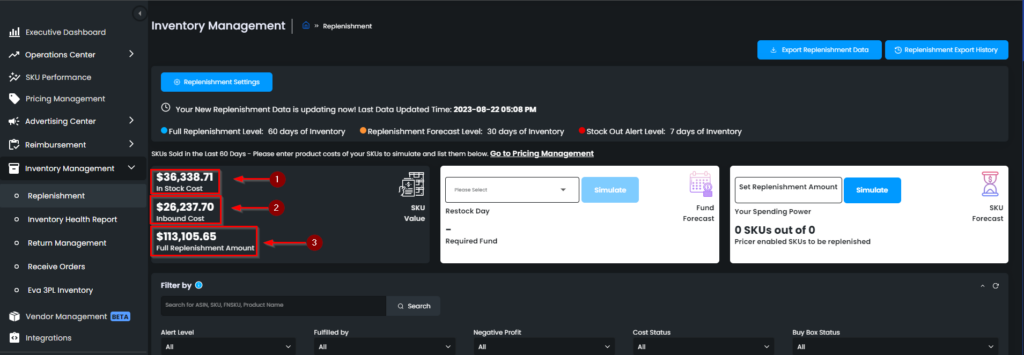
There are the three numbers on the card as explained below.
In Stock Cost Value
This figure represents the total monetary amount of the items that are currently in stock. Please see arrow 1 in Figure 6 below.
Inbound Cost Value
This figure represents the total monetary amount of the items that are currently inbound. Please see arrow 2 in Figure 6 below.
Full Replenishment Amount
This figure represents the total monetary amount of the items that are currently fully replenished. Please see arrow 3 in Figure 6 below.
Fund Forecast Card
With this card, you can calculate the forecasted amount needed to replenish the items for the chosen interval. To see the forecasted amount go and choose the interval from the dropdown menu on the card. And click “Simulate”. Please see Figure 7 below. The required fund to replenish the items for the chosen interval will be calculated. Please note that this calculation is a forecast.

SKU Forecast Card
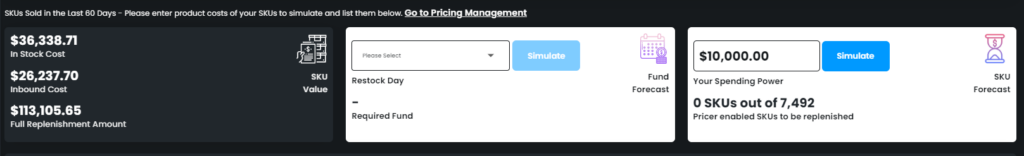
With this card, you can check how many of the SKUs can be replenished with your current spending power. Your Spending Power demonstrates the amount you can spend to replenish your items. You may change this amount to your income. Once you enter a manual amount on this box and click on “Simulate,” the system calculates again by filling in the Stock Out Alert Period for all SKUs and continuing accordingly to your spending power. They are listed according to the criteria of being the most profitable and having the fewest days of supply. To check it out, go and enter your spending power in the related field and click “Simulate”. Please see arrow 1 in Figure 8 below. Once you click on the simulate button, how many of the pricer-enabled SKUs can be replenished with your current spending power will be displayed on the same card. Please see arrow 2 in Figure 8.
Once you click on the simulate button, the SKUs to be replenished that are sold in the last 30 days will be listed down below. Scroll down to see the list. Please note that only the SKUs for which cost information is entered can be listed. To learn more about the SKU list on the replenishment page, follow the link.
Replenishment Filters
You can filter your SKUs according to your preferred settings. In the Filter section, you will find 5 different filter options. See Figure 9.
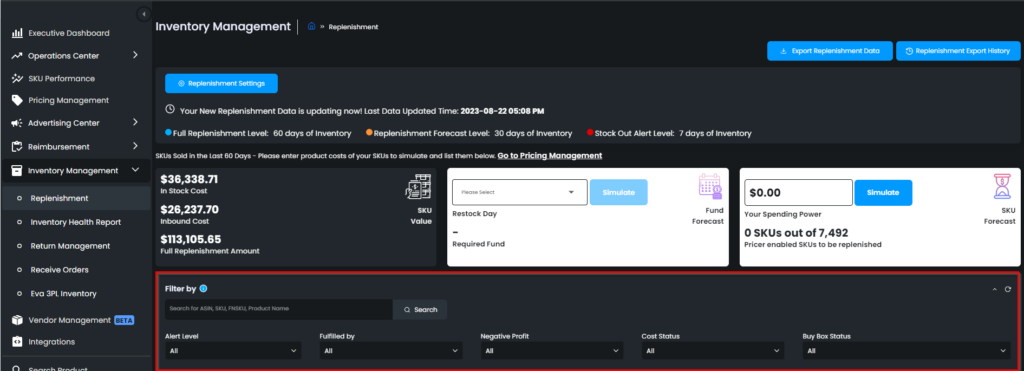
They are:
Alert Level: This filter option allows you to filter your SKUs according to their alerts. (Stock Out, Replenishment, and Full Replenishment)
Fulfilled by: This filter option allows you to filter your SKUs according to their fulfillment types. (Amazon and Merchant)
Negative Profit: This filter option allows you to filter your SKUs according to their profit statuses. (Negative Profit, Negative Margin, and Negative ROI)
Cost Status: This filter option allows you to filter your SKUs according to their cost statuses. (With Cost and Without Cost)
Buy Box Status: This filter option allows you to filter your SKUs according to their buy box statuses. (Buy Box Win, Buy Box Sharing, etc.)
SKU List on Replenishment Page
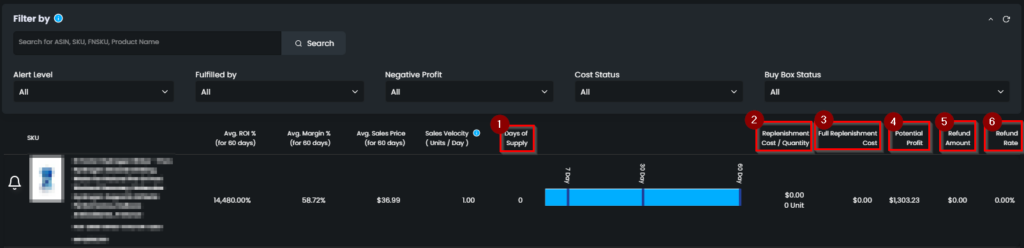
Once you click on “Simulate” you will see information about your SKUs like their margin, sales price, sales velocity, and days of supply on the list below.
Your SKUs will be listed according to the Restock Day you selected. You can click on any typing on this list, and it will direct you to the SKU Scorecard.
1. Days of Supply shows how long the inventory on hand will last according to their sales velocity.
2. The Replenishment Cost/Quantity is obtained by multiplying the product cost by the number of products to be replenished.
3. Full Replenishment Cost tells you the amount you will pay if you replenish all the products that need to be filled for a Full Replenishment Period; in this example, it equals 30 days. The SKUs are listed from the highest profit to the lowest due to the potential replenishment.
4. Potential Profit is calculated according to the Restock Day you have chosen. This feature is allowing you to make a more accurate and in-depth analysis.
5. Refund Amount is where you can track how much Amazon refunded.
6. Refund Rate This rate is calculated in percentage, like below: A number of returned orders (or refunded ones) owing to product-related issues Divided by a total number of shipped orders. See Figure10
When you hover your mouse over the top of the box, it shows the available, FC transfer, inbound, replenished, and replenishment quantity. Please see Figure 11 below.

Available stock displays with green, inbound stock displays with orange, and FC transfer stock displays with yellow color.
When you hover your mouse over the area till the 21 days marker, the chart will show you the amount you need to replenish to have 21 days of supply.