Eva’s Product Performance Card: Unlocking Insights for Product Analysis
Monitoring the performance of individual products is crucial for making informed decisions and optimizing sales. Eva’s SKU Performance Card provides a comprehensive overview of your product’s performance on Amazon. From sales and advertising metrics to inventory and profitability analysis, this powerful tool empowers you to delve deeper into product performance and make data-driven decisions. Let’s explore the key features and benefits of Eva’s SKU Performance Card.
Filtering Option
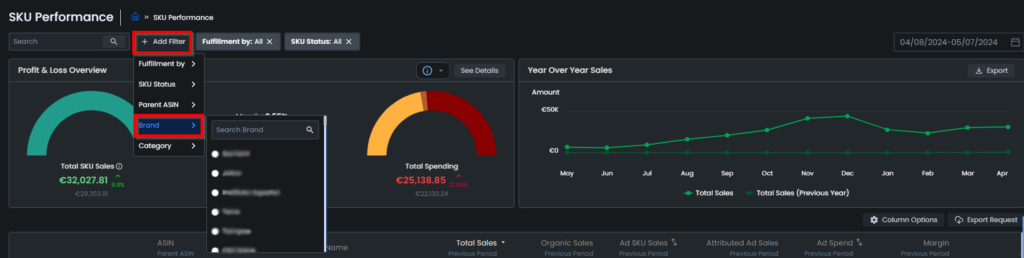
You can select the following filtering options to see detailed information; Fulfillment By: Choose how the SKU is fulfilled, whether it’s by Amazon (FBA), Merchant (FBM), or all. SKU Status: Filter by the status of the SKU, such as Available, Out of Stock, or any other relevant status labels. Parent ASINs: Filter by the Parent ASINs to narrow down results to specific product families or groupings. Brand: Select a specific brand to filter SKU performance data associated with that brand.
To filter a brand-type product, click on the “Add Filter” option located in the search box. Upon clicking, a dropdown menu will appear, providing options to filter products by brand. Choose the desired brand from the list. Initially, only a single brand selection can be made. With ongoing developments, our system will soon support the functionality to make multiple brand selections simultaneously. This enhancement is particularly beneficial for stores with a large product group, as it enables users to efficiently navigate through various brand offerings.
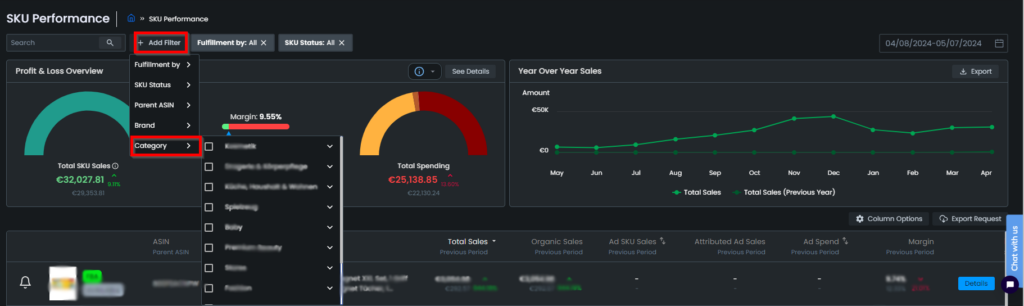
With the filtering feature, you can filter searches by single or multiple products across categories and their subsets.
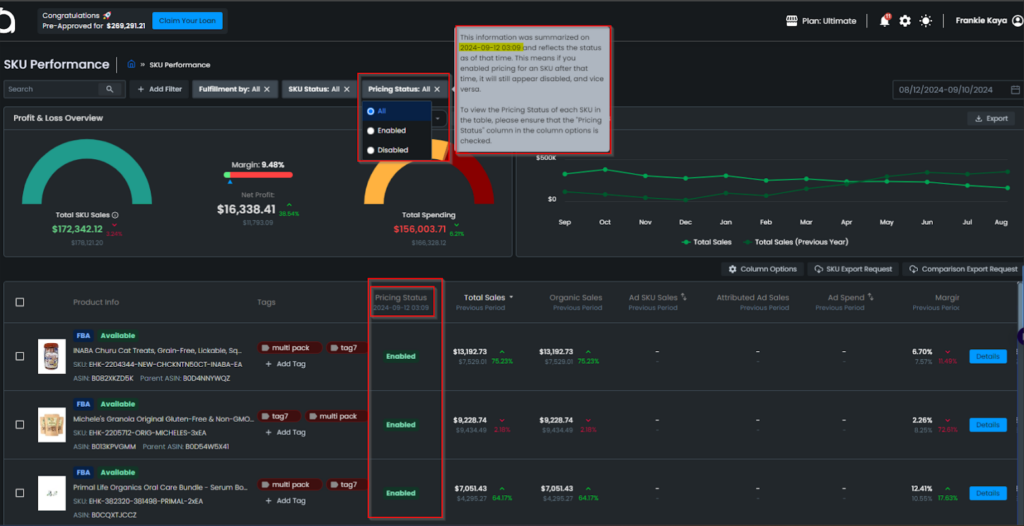
Additionally, a new Pricing Status column has been added to the SKU Performance list. This column displays whether pricing is enabled or disabled for each SKU. You can choose to display or hide this column through the “Column Options.” There is also a new Pricing Status Filter, allowing you to filter SKUs by their pricing status—either Enabled or Disabled.
Yearly Total Sales Graph
You can monitor the monthly performance of your SKUs by comparing them with the same period in the previous year using the Yearly Total Sales Graph.
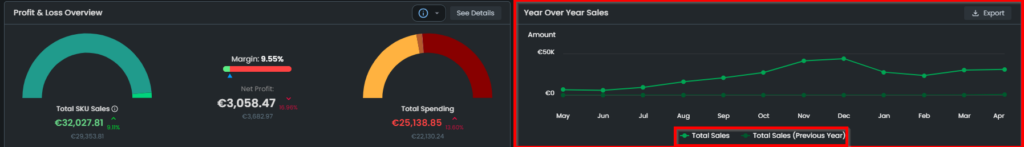
Profit and Loss Overview
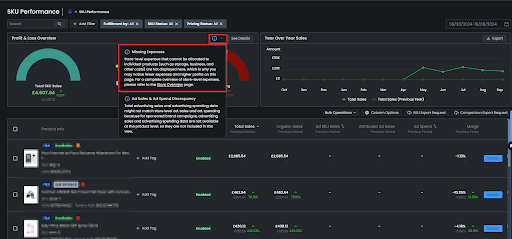
We have added a new informational note to the tooltip in the Profit & Loss Overview on the SKU Performance page.
This update clarifies that store-level expenses (such as storage, business, and other costs) that cannot be allocated to individual products are not displayed in this view.
As a result, you may notice fewer expenses and potentially higher profits on this page.
Product Listing Page
On the product listing page, you can see relevant information about your SKUs at a quick glance. You can filter your SKUs by Fulfillment type and SKU status by using the filters on the Filter by section. You can also choose a time frame such as the last 7 days, 14 days, 30 days, 60 days, and custom period. The details in the blue squares show the comparison of the current period with past periods. This makes it easy to understand how much change has occurred during this period. This overview provides a quick snapshot of the product’s performance and helps identify areas that require attention. Once you click on Details you will have access to other related charts.
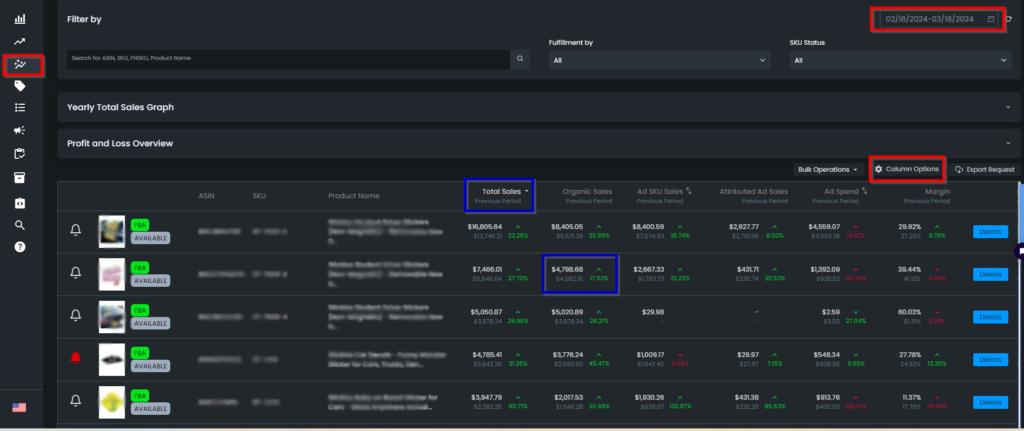
On this page, you can select any information that is important to you to be displayed next to your products’ ASIN, SKU, and Product Name. To select which information you want to see displayed, simply click the “Column Options” button, and tick the boxes next to the information you choose in the window that opens. See Figure 2 below:
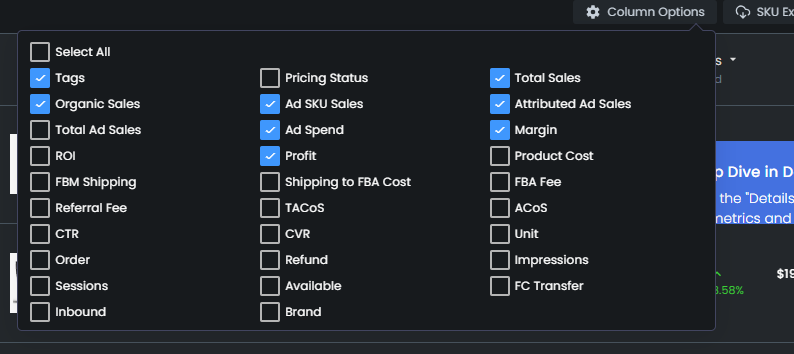
This way you can choose from a variety of metrics including Total Sales, Organic Sales, Ad SKU Sales, Ad Sales, Ad Spend, Profit, and Margin. The option to customize the SKU performance page provides the flexibility needed to analyze the unique needs of your business without being overwhelmed by too much data.
Export Your SKUs
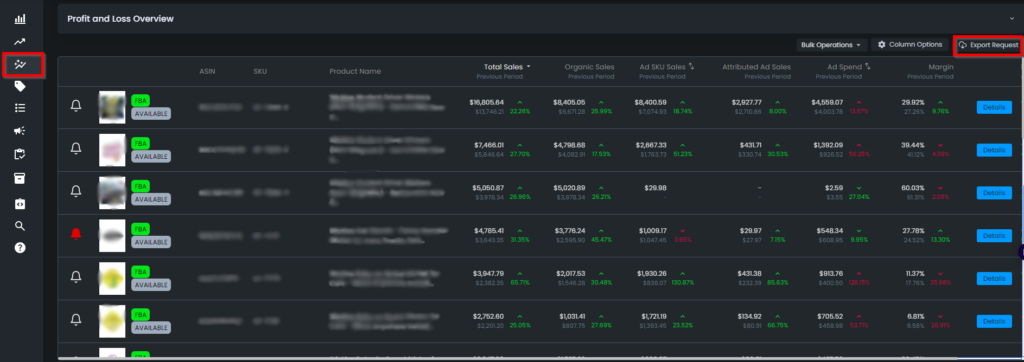
The export function on the SKU performance list page allows you to easily download detailed metrics for each SKU including organizing and advertising sales, conversation rates, inventory amounts, etc. which can make you gain immediate insights into the profitability of each SKU.
To get this export, you can click the “Export Request” button on the SKU Performance tab. Eva immediately starts to generate the file. While the file is being generated, the button is rendered as “In progress”. When the process is finished, the button turns into “Download” You can click and download the file.
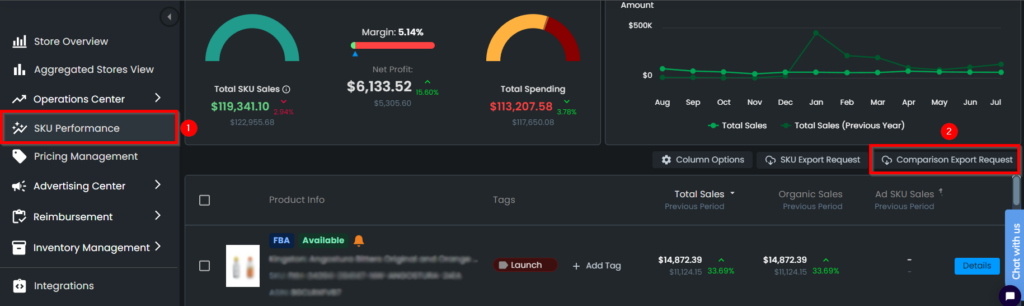
Comparison Export
You can click on the “Comparison Export Request” button to download a report that includes current and past values, along with the change rates in SKU Performance.
To get the comparison export, please navigate to the SKU Performance List. Click on the “Comparison Export Request” button.
Once the export is ready, a blue “Download Comparison List” button will appear. You can click on this button to download the file.
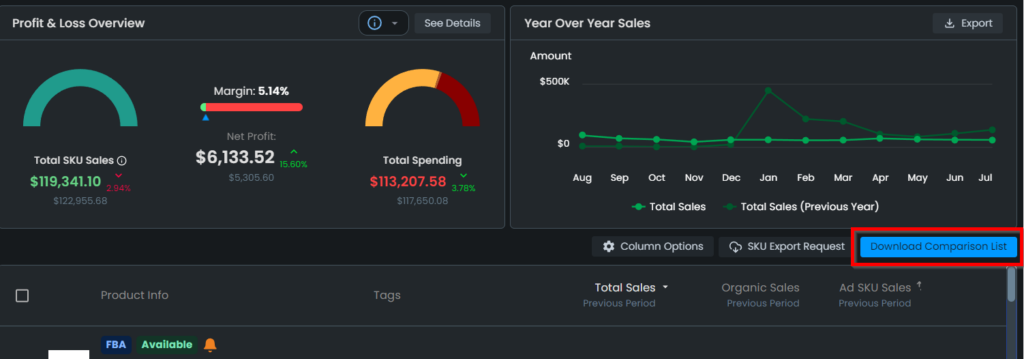
The system will generate a comprehensive report that includes current and past values, as well as the change rates for your SKU Performance.
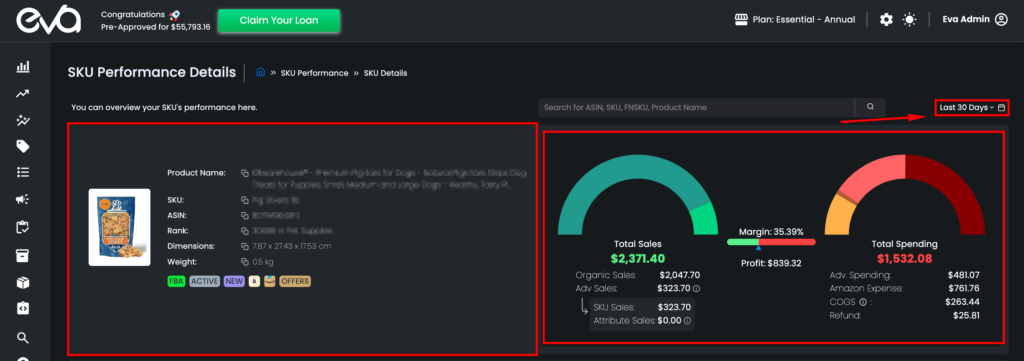
SKU Performance Details
For a more comprehensive analysis, you can dive into each product’s details on the SKU Performance Details page. Here, a product info card displays crucial sales and spending information. The flexibility of date filtering options, ranging from the last 7 days to custom dates, allows sellers to analyze performance over specific time periods.
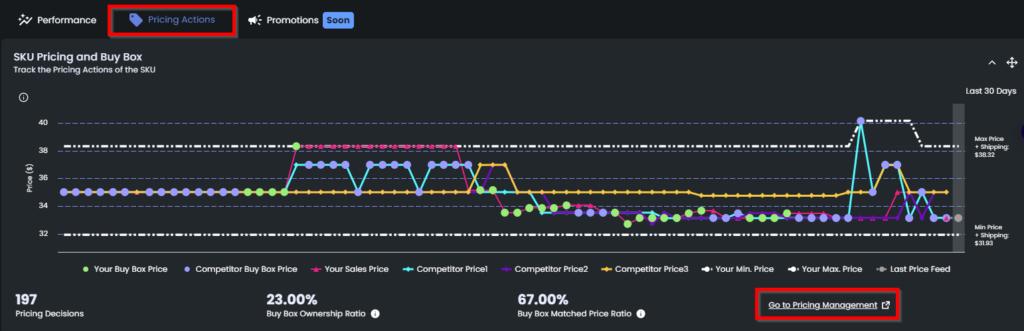
Pricing Actions
The “Pricing Actions” tab contains information about the pricing actions taken by Eva and compares them against the buy box price, your minimum and maximum price, the competitors’ prices and so on. For more information regarding the pricing actions, please refer to this help page.
If you need to make any changes to the features or your prices, click “Go to Pricing Management”.
Eva’s SKU Performance Card offers four exportable charts that provide deeper insights into various aspects of product performance:
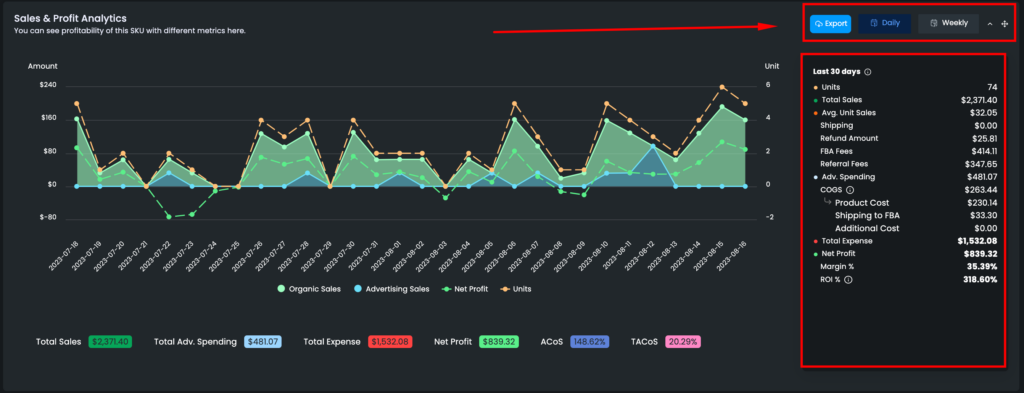
Profit Analytics Chart
This chart enables you to gauge the profitability of your SKU by presenting total sales, total expenses, and units sold. It further breaks down metrics such as Units, Sales Amount, Shipping, Refund Amount, FBA Fees, Referral Fees, COGS, Adv. Spending, Total Expense, Net Profit, Margin, and ROI. You can analyze this data on a daily or weekly basis and export it for detailed analysis.
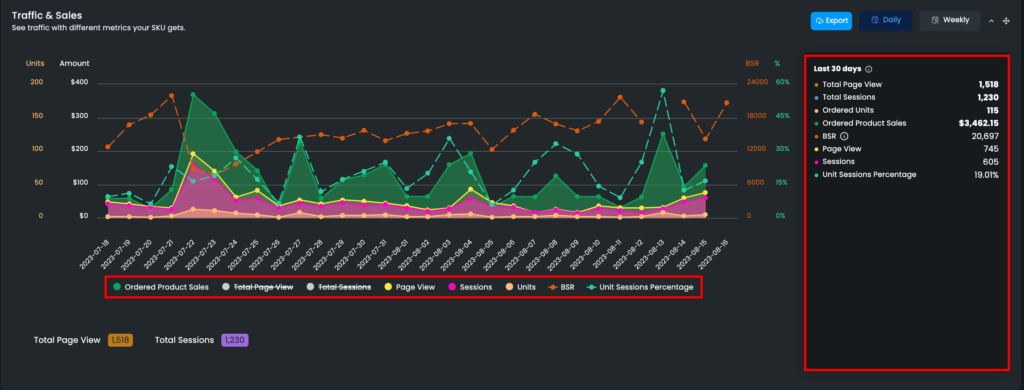
Traffic & Sales Chart
Understanding product visibility and customer engagement is vital for success. The Traffic & Sales Chart tracks key metrics, including total page views, total sessions, page views, sessions, BSR (Best Sellers Rank), and unit sessions. These insights shed light on customer behavior and provide valuable information for optimizing product visibility and driving sales.
Key Performance Metrics Chart
Utilizing advertising, and tracking the effectiveness of your campaigns is essential. The Key Performance Metrics Chart offers a breakdown of metrics such as Margin, ROI, ACoS (Advertising Cost of Sales), TACoS (Total Advertising Cost of Sales) and ROAS (Return on Advertising Spend). As part of our ongoing efforts to provide deeper insights and improve decision-making capabilities for our clients, we have introduced two new metrics: Ad.CVR and Total CVR. This information empowers you to refine your advertising strategies and maximize returns on investment.
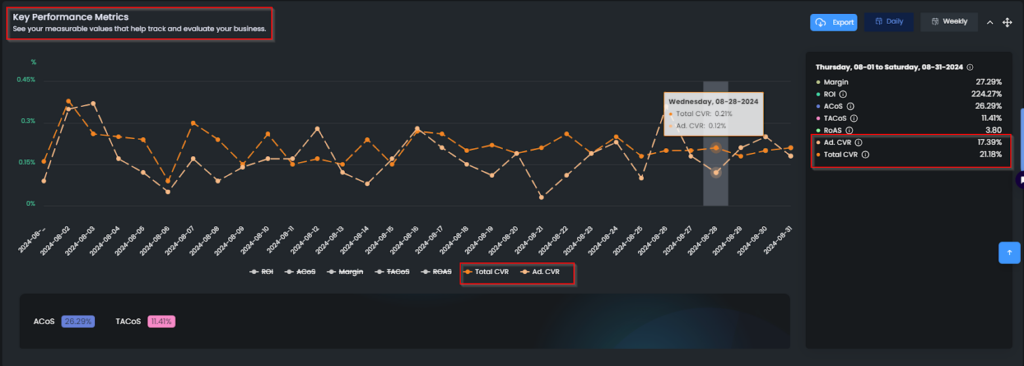
- Ad. CVR (Advertising Conversion Rate):
This metric calculates the percentage of ad-driven orders from total clicks on ads, giving users a clearer understanding of their advertising campaign effectiveness.
Formula: Ad Orders / Clicks
- Total CVR (Total Conversion Rate):
This metric measures how well total traffic is converting into orders across all sessions, offering a more comprehensive view of the overall business performance.
Formula: Total Orders / Sessions
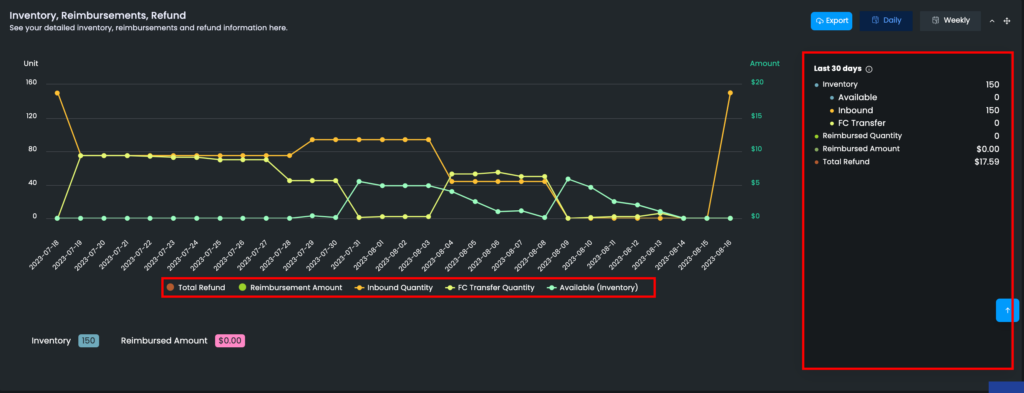
Inventory, Reimbursement, Refund Chart
Maintaining optimal inventory levels and tracking reimbursements and refunds are critical aspects of successful selling. This chart provides visibility into inventory availability, FC (Fulfillment Center) transfers, and inbound stock. It also presents data on the reimbursed quantity, reimbursed amount, and total refunds, enabling you to manage your inventory and finances effectively.
With Eva’s SKU Performance Card, you can unlock a deeper understanding of your product’s performance and take your e-commerce success to new heights.