Advertising Dashboard
Dive deep into your advertising metrics with insights into ad orders, ACoS, TACoS, and CVR (Conversion Rate). Here’s how you can get started!
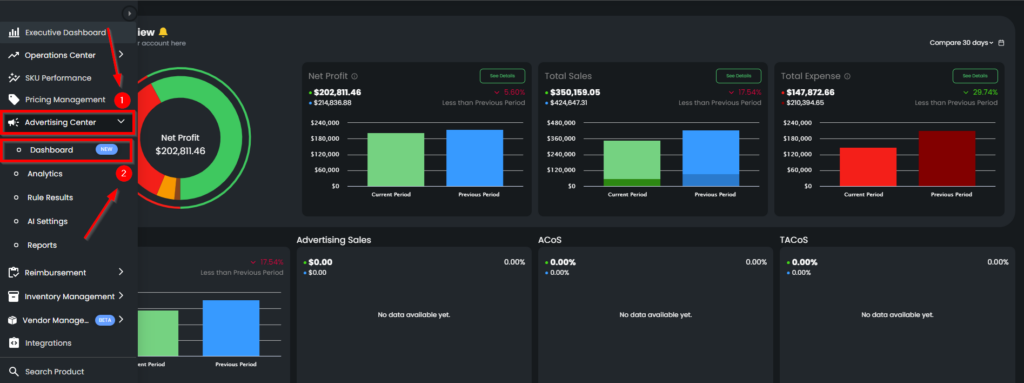
To access the Advertising Dashboard, click on Advertising Center located on the left side of the page. From there, select Advertising Dashboard.
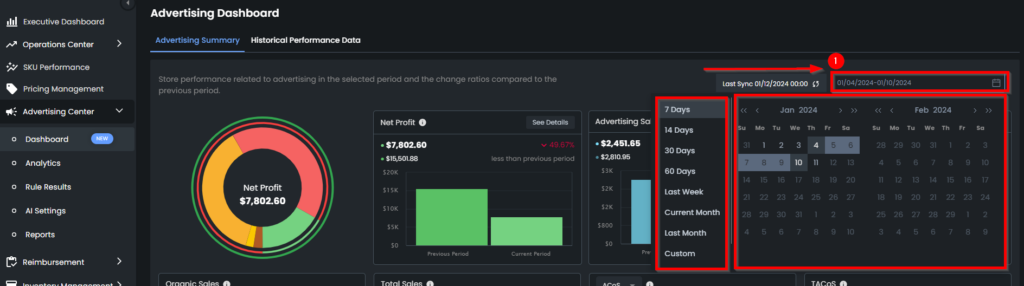
Tailor your view to match your preferences. In the upper right corner of the page, you’ll find a dropdown menu. Here, you can select from 7, 14, 30, or 60 Days, Last Week, Current Month, or Last Month as the desired timeframe and custom period. Once you’ve defined your desired timeframe, all information on the advertising summary will be updated accordingly.
Filtering Advertising Dashboard
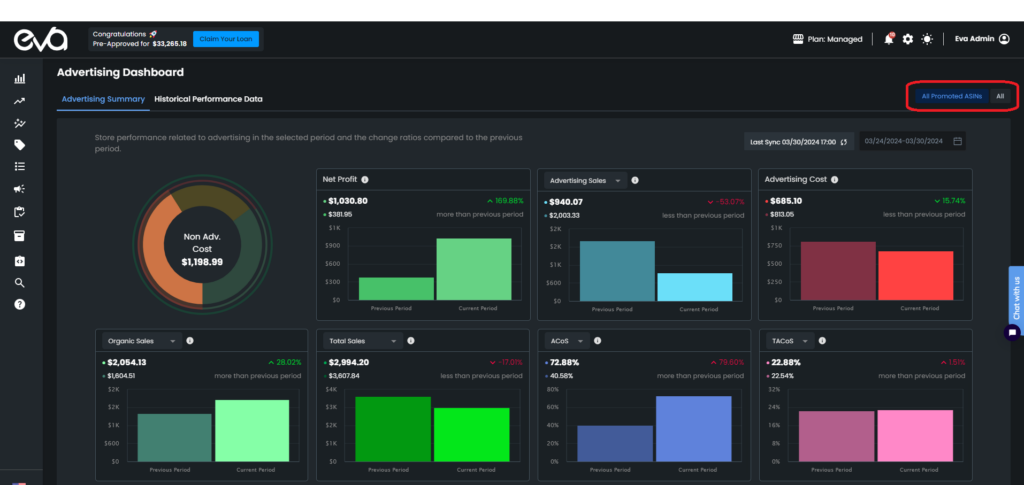
We have two filtering options on the Dashboard “All Promoted ASINs” and “All”. Eva will provide summarized Advertising Metrics specifically for Promoted ASINs.
The metrics under the “All Promoted ASINs” filter will exclusively display data for ASINs that have incurred advertising spend. Additionally, organic data for promoted ASINs, such as Profit, Organic Sales/Orders, and Total Sales/Orders, will also be incorporated into the metrics.
Advertising Summary
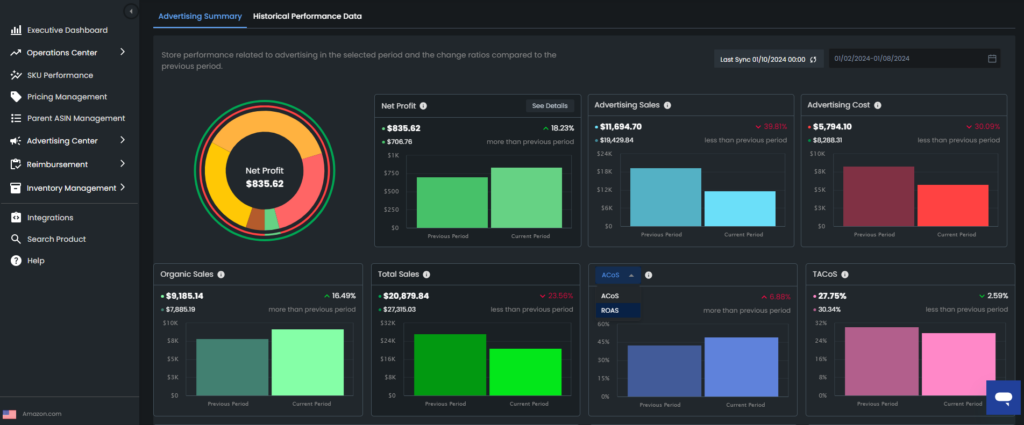
At the top of the page, you’ll find the Advertising Summary. It offers a comprehensive overview of your store’s advertising performance during the selected period. Additionally, it highlights the change ratios when compared to the previous period.
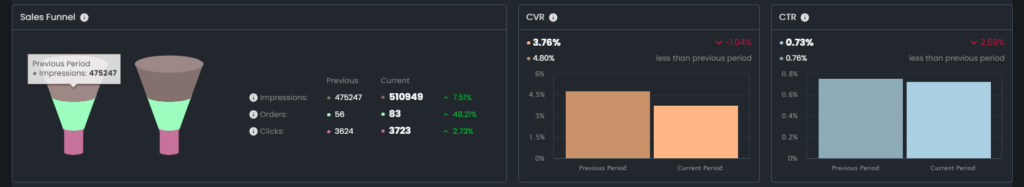
Sales Funnel
The Sales Funnel will help you see your customer’s journey from discovering a product (impressions) and engaging with it (clicks), to finally purchasing it (orders). This can help you understand how effectively each session is being converted into product sales.
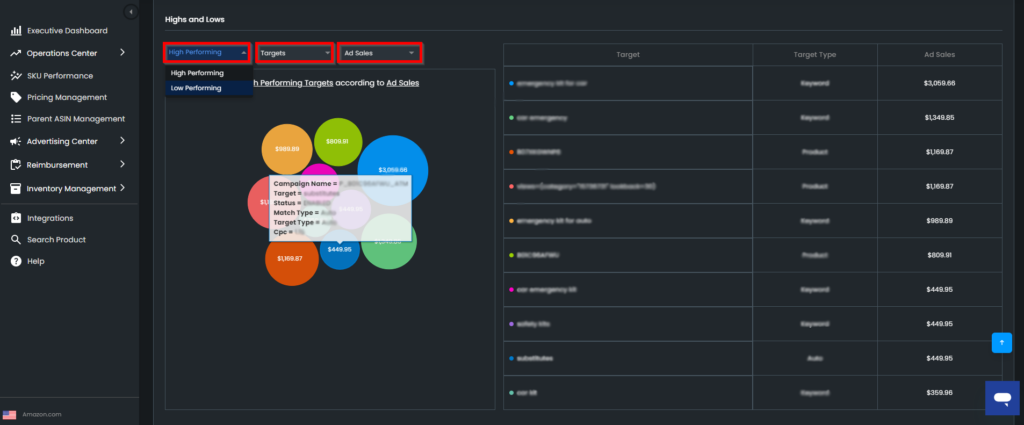
High and Low Performers
Scrolling down the page you’ll see a bubble chart that showcases the high and low-performing campaigns, targets, and products. You can easily toggle between Top and Low Performers. Also, you can select KPIs from the dropdown lists and streamline your experience further.
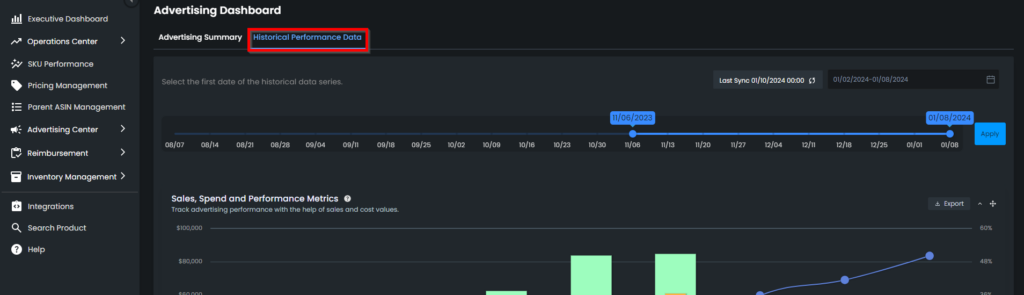
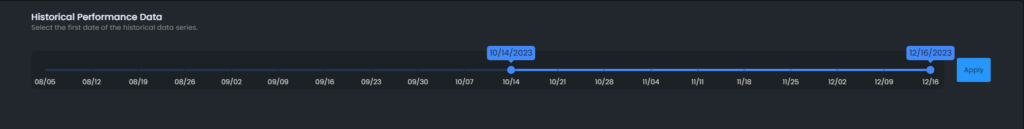
Historical Performance Data
Ready to explore more? To access the historical performance section, click Historical Performance Data next to Advertising Summary.
You can choose the exact starting point for the historical data you want to explore. Whether you need to extend or reduce the time frame, this feature offers the flexibility to tailor the data displayed on your dashboard. Once you choose the exact points, all charts will be updated accordingly.
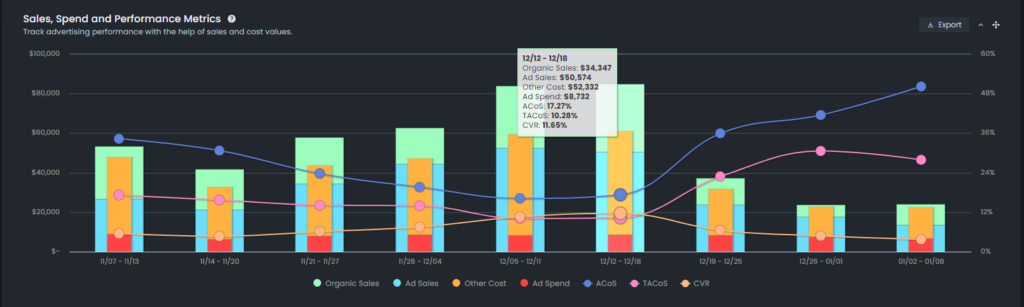
Sales, Spend, and Performance Metrics
With this chart, you can effortlessly keep track of your sales and spending data for both your organic and advertising segments, all in one convenient view. This feature streamlines the process of gaining valuable insights into your profitability trends over time. Furthermore, you can access key metrics such as ACoS, TACoS, and Conversion Rate simultaneously, making it easier to analyze your performance.
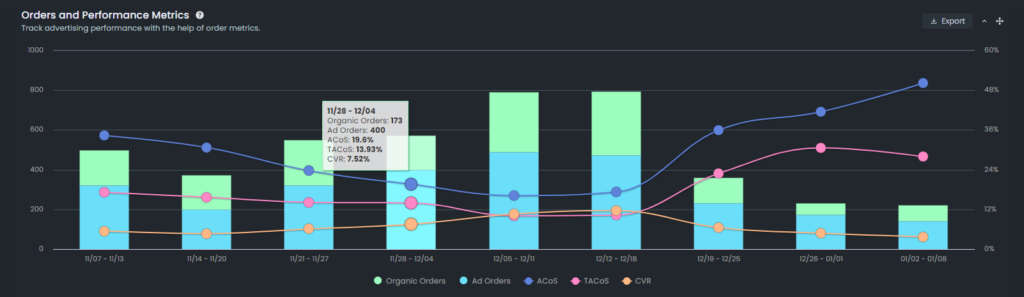
Order and Performance Metrics
Scrolling down the page, you’ll encounter order and performance metrics that assist you in monitoring advertising performance with the help of order metrics. You can see your organic orders, ad orders Acos Tacos, and CVR on this chart.
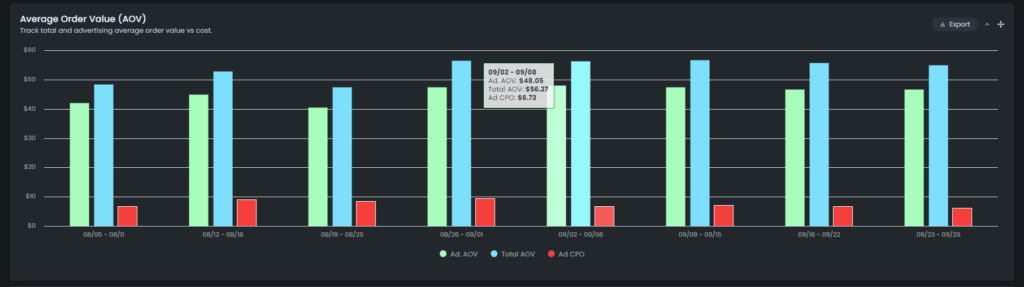
Average Order Value (AoV)
This chart tracks both the total and advertising-specific average order value relative to cost.
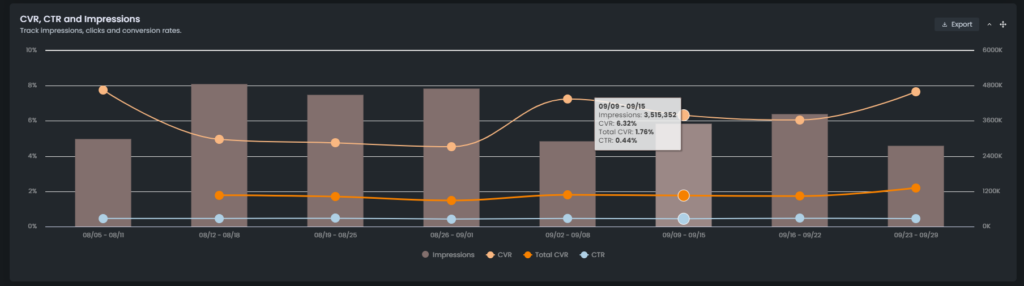
CVR, CTR, and Impressions
Gain a detailed understanding of your CVR, with a breakdown that includes a special focus on CVR calculated using total orders divided by sessions. You can also monitor impressions, clicks, and conversion rates with this chart.
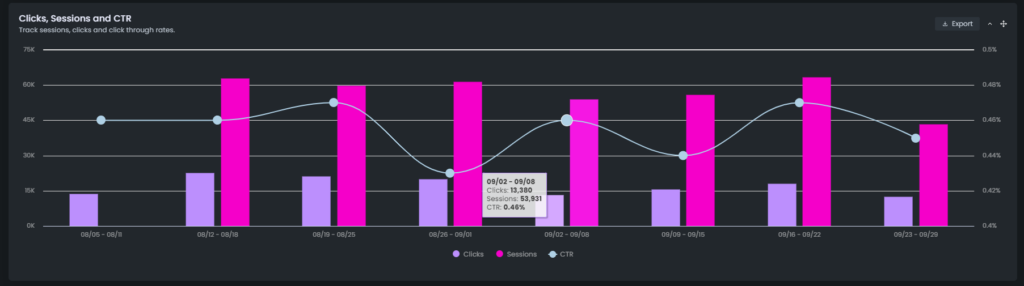
Clicks, Sessions, and CTR Metrics
This chart provides insights into sessions, clicks, and click-through rates for the selected timeframe.
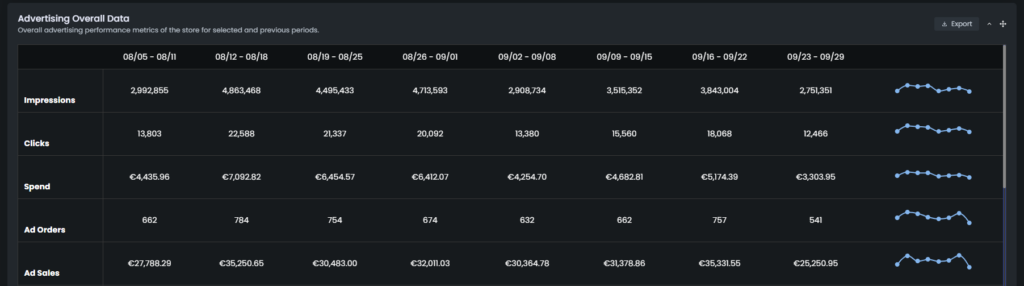
Advertising Overall Data
Towards the bottom of the page, you’ll find a comprehensive display of overall advertising performance metrics for your store, encompassing both the selected period and the previous one. Each performance metric is accompanied by a mini graph relevant to the selected timeframe.
The Advertising Dashboard equips you with the tools and insights you need to effectively optimize your advertising strategies. Explore the charts, customize your views, and stay well-informed about your store’s advertising performance.
Ready to Elevate Your Success? Book a call with our experts—just enter your email below to get started!