TOP ASINs
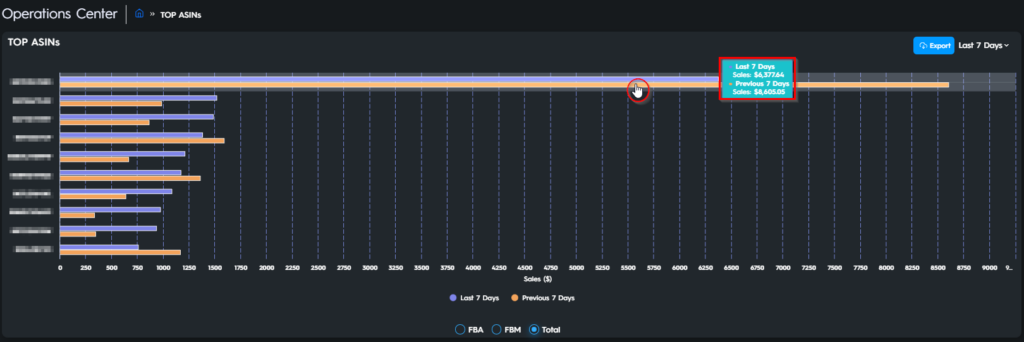
TOP ASINs graph illustrates the data of the most selling ASINs in the current day, last 7 days, last 30 days, and last 60 days and enables you to compare the performance of these best-selling items with their performance in the previous time range.
It is a two-axis graph.
Axes
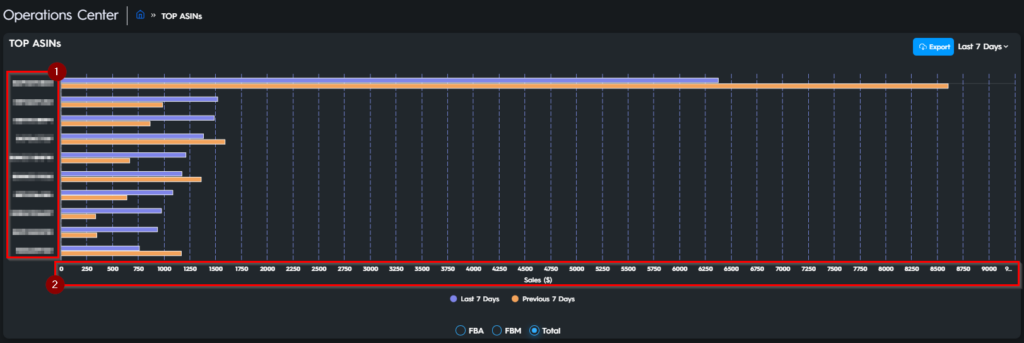
Axis 1: This axis demonstrates Amazon Standard Identification Numbers (ASINs) of the most selling ten products in the chosen time range from top to bottom, respectively from the best-selling one to the least one. Please see arrow 1 in Figure 1 below.
Axis 2: This axis demonstrates the monetary amount of sales in the currency of your marketplace. Please see arrow 2 in Figure 1 below.
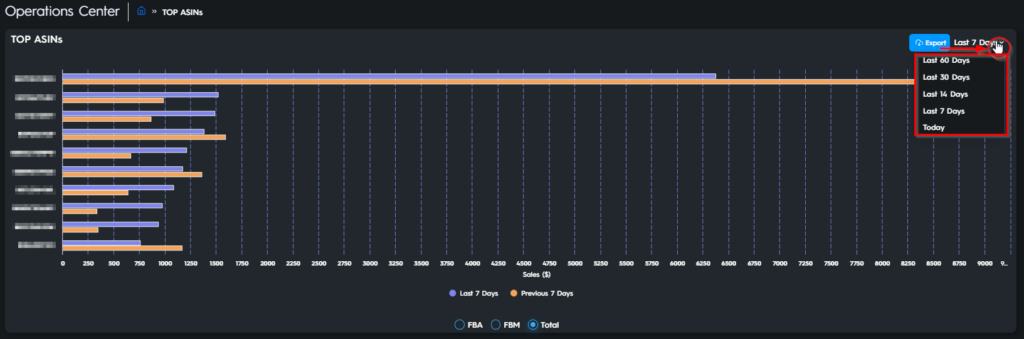
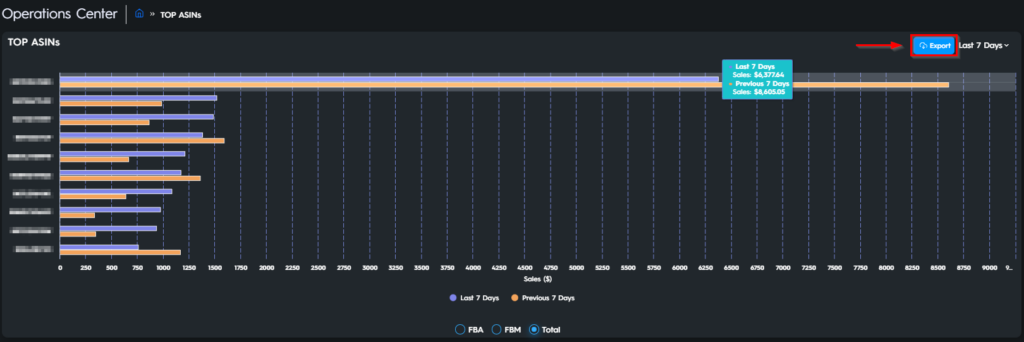
The graph, as default, is displayed with the data of the last 7 days and its comparison with the previous seven days. You can change the time range by using the dropdown menu on the upper right side. Please see Figure 2 below.
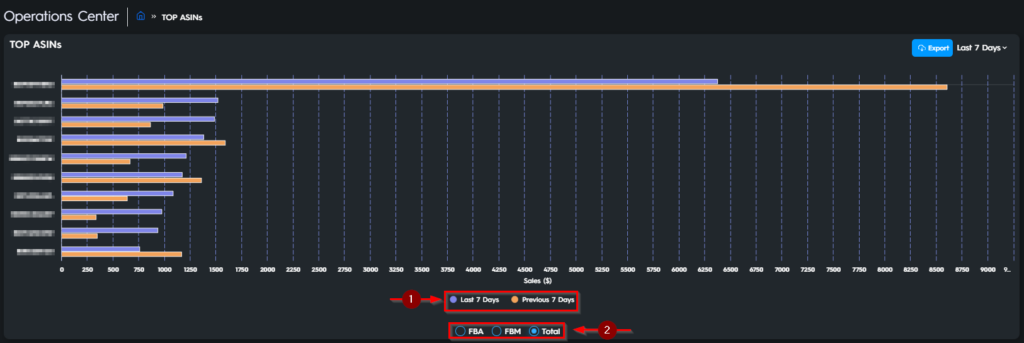
Each color represents a specific group on the chart, which is indicated with the color balls next to the related group (Axis 1). You can also filter the ‘FBA’, ‘FBM’, or the total (Axis 2). Please see Figure 3 below.
You can see the sales amount of a specific ASIN by hovering over it. A pop-up list will appear. On this list, you can compare the amount of the last period and the amount of the previous period. Please see Figure 4 below.
You can also download an excel file with all the data you see on the graph. To do so, go and choose the time range of which data you want to download and click on the ‘Export’ button to download the file. Please see Figure 5 below.
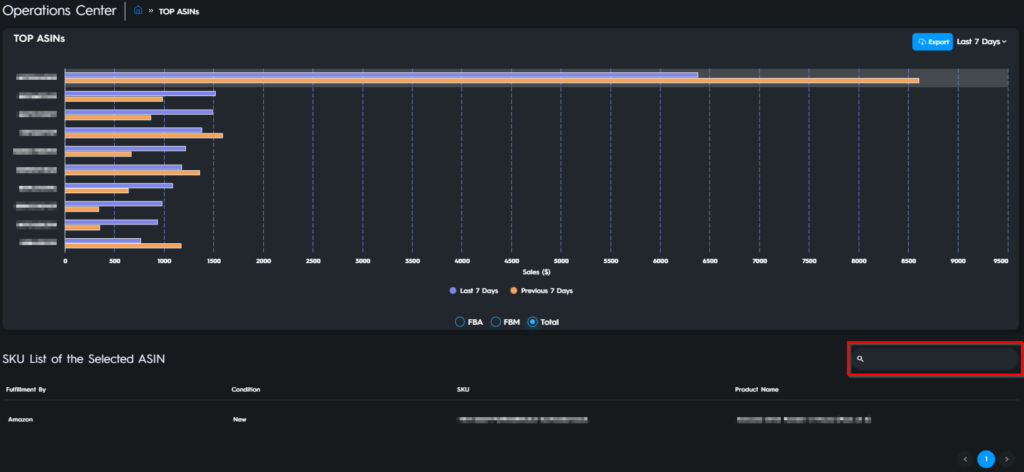
SKU List
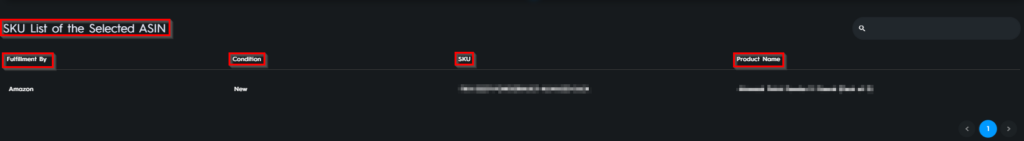
It is also possible to check the SKU list of the selected ASIN. To do so, go and click on the bar of the related ASIN, ASIN-specific information such as ‘Fulfillment Type’, ‘Condition’, ‘SKU’, and ‘Product Name’ will be displayed down below. Please see Figure 6 below.
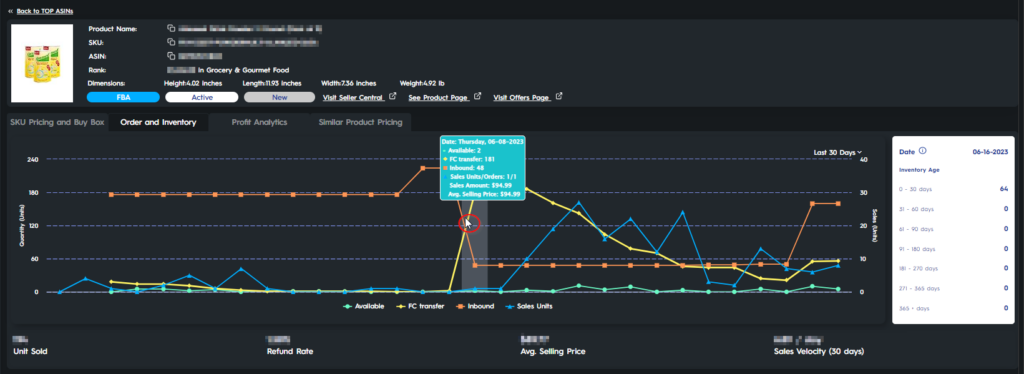
When you click on the ASIN row displayed down below, you can reach the ‘Pricing Actions and Analytics’ card for the ASIN. Please see Figure 7 below.
If there is a high number of SKUs of the selected ASIN, you can search for a specific one with the search bar on the upper right side. Please see Figure 8 below.